Call us
301-363-4651 (Available 9 a.m. to 5 p.m. CST from Monday to Friday)
- Guide to make ELISA standard curve and calculate concentration of target proteins
How to utilize our ELISA kits properly?
How to use Curve Expert to draw a standard curve and calculate the concentration of target protein?
ELISA assay is used for determining the concentration of target protein in biological samples. Three types of ELISA data output can be yielded.
Generally speaking, with quantitative ELISA kit, you can quantify target protein in samples since you test a serial of standard proteins of known concentration. When you analyze ELISA data with quantitative ELISA kit, you have to plot the mean absorbance against the protein concentration and draw a curve fitting your standard result best, and then interpolate absorbance of samples to the curve to calculate the concentration. This ELISA standard curve protocol will give you a comprehensive instruction on how to calculate ELISA results with quantitative ELISA kit step by step.
Firstly, you need to run the ELISA kit according to our guide of plate layout and get raw data from ELISA reader, and then let's go to the next step—statistical analysis of ELISA results, which is the last and the key step to get the concentration of target protein in your samples. We recommend you an ELISA data analysis software curve expert 1.4 that is simple to use and you can download at the end of this page to process data calculation. There are many other curve fitting softwares available in the market to conduct ELISA calculation as well such as GraphPad Prism or you can also use normal MS Excel for analysis.
Firstly, output the readings of the plate reader;
Secondly, open the drawing software to be run, input the standard OD and concentration values into the software, and select the model with the best fit;
Finally, combined with software, calculate the concentration value of the sample to be tested; Alternatively, input the fitting formula into Excel to calculate the concentration value of the test sample.
Now I will show you how to make an ELISA standard curve step by step.
You can also watch this video first.
Here we use "Curve Expert 1.4" as an example to show you how to operate the software and process data analyzing.
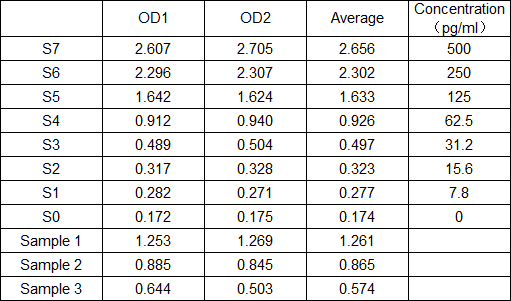
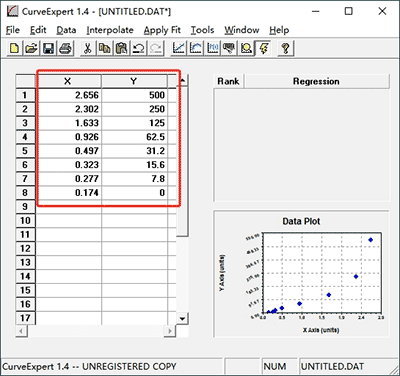
1.1 Download and start "Curve Expert 1.4", and then input the data.
1.2 Input OD values (X-axis) and corresponding concentration (Y-axis) of standards. You can copy the data from excel sheet directly to the worksheet in the software.
2.1 Click the run button, click OK, and the software will fit different forms. Though the software will recommend the best fitting curve, you can still select curve manually by double clicking different regression. Select the curve with “r” value closest to “1”.
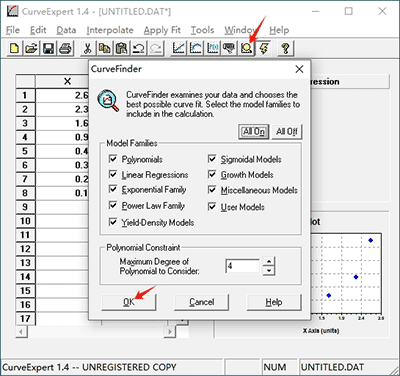
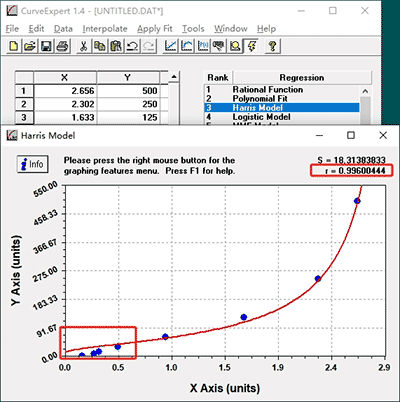
Selecting an appropriate curve-fitting regression is important since concentration of samples will be calculated according to the standard curve. The closer “r” value is to “1”, the stronger correlation there is between OD and concentration.
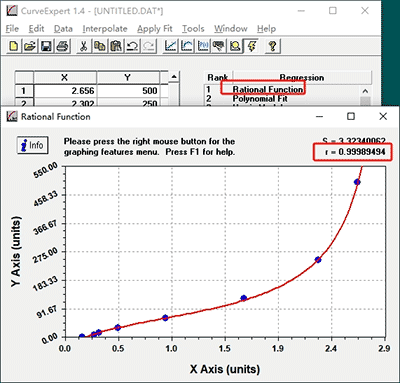
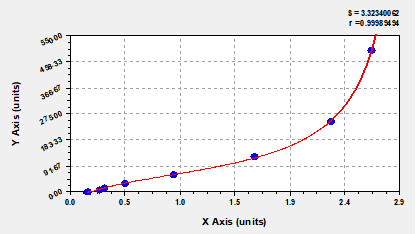
In this example we finally select “Rational Function” since its “r” value is closest to “1” compared with other standard curves.
How to calculate concentration?
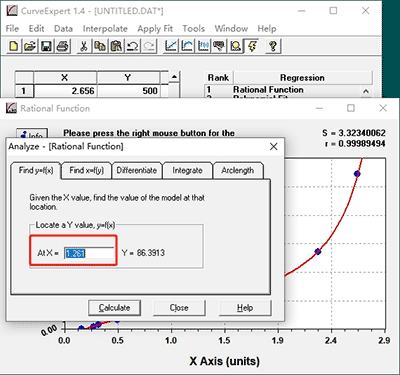
3.1 Analyze ELISA data in the software.
The software allows easy location of x/y points, differentiation, and integration of a curve fit that has been performed by choosing Analyze from the graphing menu or pressing Ctrl+L. In this example we would like to find the concentration of target protein (Y value) by evaluating the curve fit at a given OD (X value). Just type in the point at which you want to evaluate the curve fit (the x value) in the "At X=" field and press [ Calculate ] or [ Enter ] on your keyboard. The calculator will then show the corresponding y value.
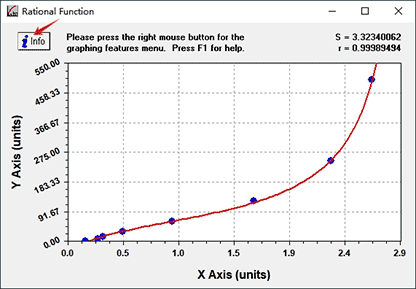
3.2 Analyze ELISA data in the Excel sheet.
Press [Info] button to open model information dialog which gives all of the information needed to apply a curve fit and some supplemental information about the performance of the given model. The most important information contained in this panel is the values of the parameters of the model.
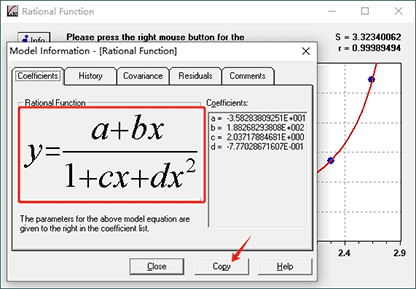
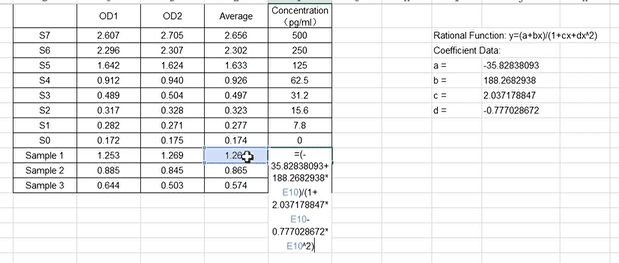
If we click [ Copy ], the list of coefficients is copied to the clipboard. Then paste them in any Excel sheet.Bring X (OD), a, b, c, d value into the formula respectively and then press [ Enter ] on your keyboard to calculate concentration.
Note:To get the most accurate results, it is recommended to do a pre-text to determine the appropriate dilution factor to make sure that the concentration of target protein in the samples after dilution falls into the range of standard curve. If the sample has been diluted, the dilution factor should be taken in to account during calculation.
Please download Curve Expert1.4.zip
"Curve expert 1.4" is not compatible with Macs.
If you need the software for Macs, you can download here:
http://download.cnet.com/CurveExpert-Professional/3000-2054_4-75332285.html
It is a paid software. If you are not willing to use it, you can make the standard curve by Excel or other softwares, or you can send us your data and we will process the data for you.