Call us
301-363-4651 (Available 9 a.m. to 5 p.m. CST from Monday to Friday)
| Code | CSB-E08180m |
| Size | 96T,5×96T,10×96T |
| Price | Request a Quote |
| Trial Size |
24T ELISA Kit Trial Size (Only USD$150/ kit) * Sample kit cost can be deducted as a $30 credit for each 96-assay kit of the same analyte and brand you subsequently purchase within six months until depleted. More details >> Interested in a trial size? Please leave a message below.
|
| Have Questions? | Leave a Message or Start an on-line Chat |
Intra-assay Precision (Precision within an assay): CV%<8% | ||||||||||||||||||||||||
Three samples of known concentration were tested twenty times on one plate to assess. | ||||||||||||||||||||||||
Inter-assay Precision (Precision between assays): CV%<10% | ||||||||||||||||||||||||
Three samples of known concentration were tested in twenty assays to assess. | ||||||||||||||||||||||||
| Intra-Assay Precision | Inter-Assay Precision | ||||||||||||||||||||||
Sample | 1 | 2 | 3 | 1 | 2 | 3 | ||||||||||||||||||
n | 20 | 20 | 20 | 20 | 20 | 20 | ||||||||||||||||||
Mean(pg/ml) | 516.646 | 497.903 | 491.373 | 484.723 | 483.883 | 477.090 | ||||||||||||||||||
SD | 0.035 | 0.033 | 0.038 | 0.041 | 0.041 | 0.038 | ||||||||||||||||||
CV(%) | 7.172 | 6.286 | 7.350 | 8.055 | 8.039 | 7.600 | ||||||||||||||||||
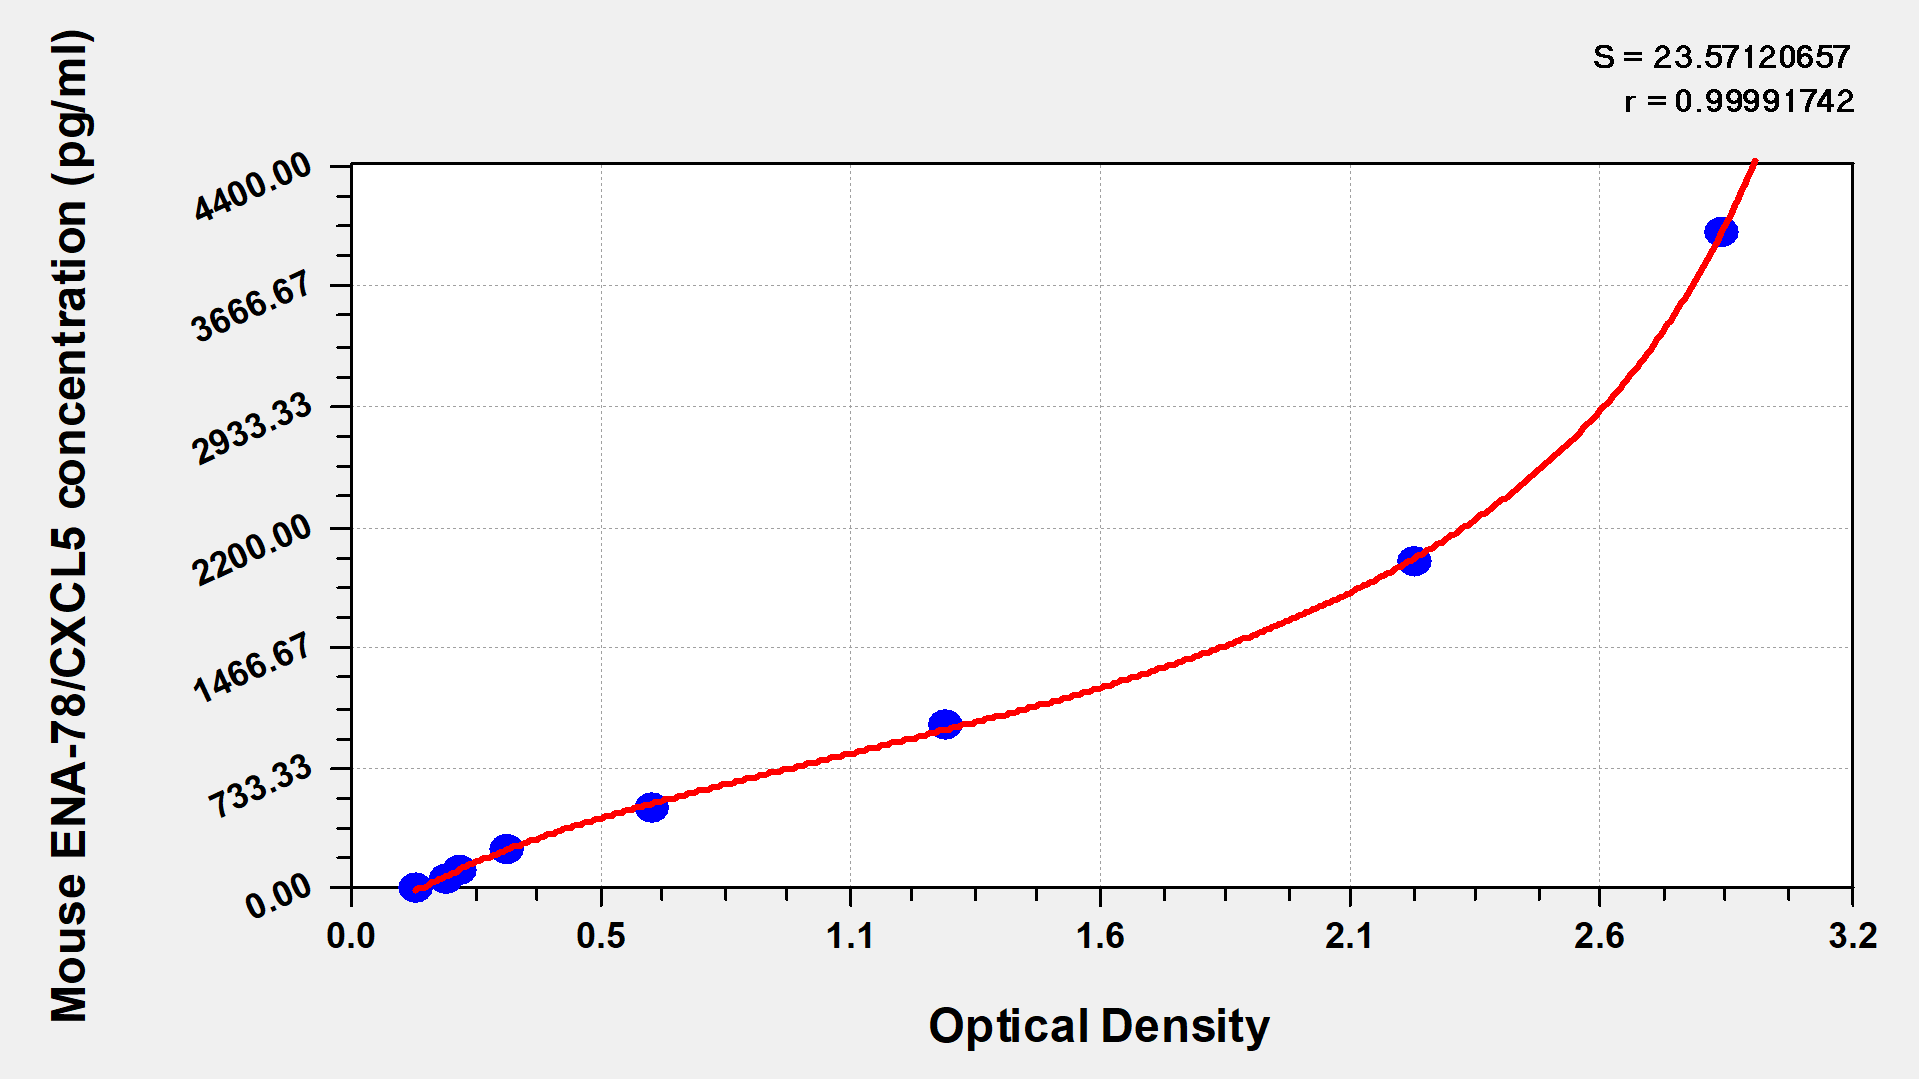
TYPICAL DATA These standard curves are provided for demonstration only. A standard curve should be generated for each set of samples assayed.
| ||||||||||||||||||||||||
pg/ml | OD1 | OD2 | Average | Corrected | ||||||||||||||||||||
4000 | 2.88 | 2.876 | 2.878 | 2.726 | ||||||||||||||||||||
2000 | 2.239 | 2.235 | 2.237 | 2.085 | ||||||||||||||||||||
1000 | 1.263 | 1.259 | 1.261 | 1.109 | ||||||||||||||||||||
500 | 0.646 | 0.642 | 0.644 | 0.492 | ||||||||||||||||||||
250 | 0.342 | 0.338 | 0.340 | 0.188 | ||||||||||||||||||||
125 | 0.249 | 0.245 | 0.247 | 0.095 | ||||||||||||||||||||
62.5 | 0.218 | 0.214 | 0.216 | 0.064 | 0.064 | |||||||||||||||||||
0 | 0.154 | 0.150 | 0.152 |
|
| |||||||||||||||||||
To assess the linearity of the assay, samples were spiked with high concentrations of mouse ENA-78/CXCL5 in various matrices and diluted with the Sample Diluent to produce samples with values within the dynamic range of the assay. | |||||||||||||||||||||
| Sample | Serum(n=4) | |||||||||||||||||||
1:20 | Average % | 88 | |||||||||||||||||||
Range % | 83-91 | ||||||||||||||||||||
1:40 | Average % | 104 | |||||||||||||||||||
Range % | 98-108 | ||||||||||||||||||||
1:80 | Average % | 92 | |||||||||||||||||||
Range % | 87-96 | ||||||||||||||||||||
1:160 | Average % | 96 | |||||||||||||||||||
Range % | 91-99 | ||||||||||||||||||||
The recovery of mouse ENA-78/CXCL5 spiked to levels throughout the range of the assay in various matrices was evaluated. Samples were diluted prior to assay as directed in the Sample Preparation section. | |||||||||||||||||||||
Sample Type | Average % Recovery | Range% | |||||||||||||||||||
Serum (n=5) | 90 | 84-94 | |||||||||||||||||||
EDTA plasma (n=4) | 94 | 87-97 | |||||||||||||||||||
Sample type: Cell culture supernatant
Sample species: Mouse
Sample dilution: No dilution
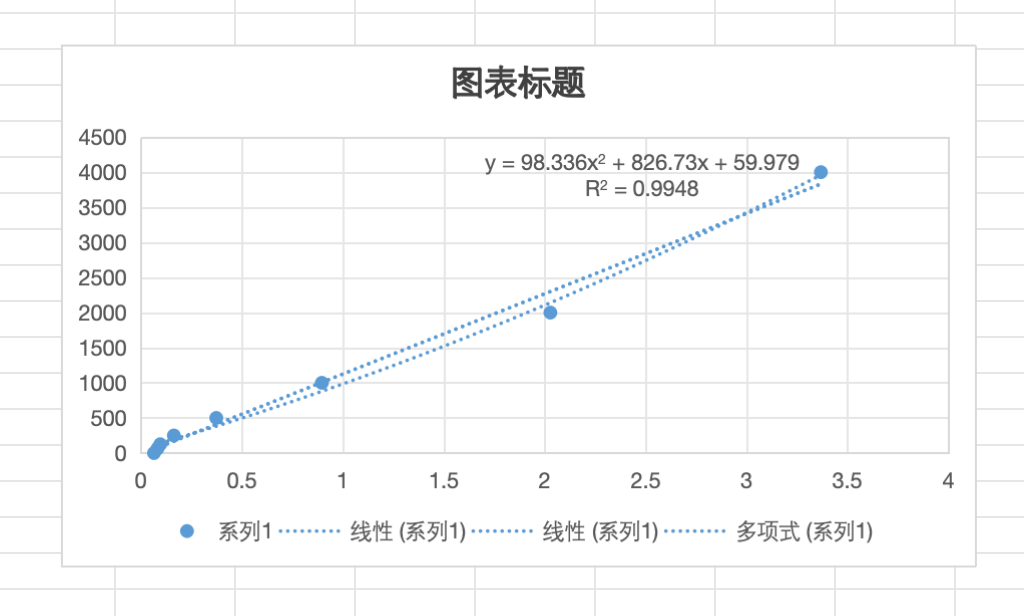
Review: CSB-E08180m was used to detect the supernatant of normal cells and the supernatant of cells treated with il-17a. The OD value of the standard curve was 3.3675-0.064, and the OD value of samples was 0.076-0.183. The detection process was clear and the results were accurate.
By Anonymous