Call us
301-363-4651 (Available 9 a.m. to 5 p.m. CST from Monday to Friday)
| Code | CSB-E04586h |
| Size | 96T,5×96T,10×96T |
| Price | Request a Quote |
| Trial Size |
24T ELISA Kit Trial Size (Only USD$150/ kit) * Sample kit cost can be deducted as a $30 credit for each 96-assay kit of the same analyte and brand you subsequently purchase within six months until depleted. More details >> Interested in a trial size? Please leave a message below.
|
| Have Questions? | Leave a Message or Start an on-line Chat |
Intra-assay Precision (Precision within an assay): CV%<8% | ||||||||||||
Three samples of known concentration were tested twenty times on one plate to assess. | ||||||||||||
Inter-assay Precision (Precision between assays): CV%<10% | ||||||||||||
Three samples of known concentration were tested in twenty assays to assess. | ||||||||||||
| Intra-Assay Precision | Inter-Assay Precision | ||||||||||
Sample | 1 | 2 | 3 | 1 | 2 | 3 | ||||||
n | 20 | 20 | 20 | 20 | 20 | 20 | ||||||
Mean(ng/ml) | 12.616 | 12.563 | 12.347 | 12.861 | 12.777 | 12.563 | ||||||
SD | 0.030 | 0.029 | 0.028 | 0.040 | 0.039 | 0.041 | ||||||
CV(%) | 5.217 | 5.052 | 4.912 | 7.130 | 6.747 | 7.143 | ||||||
To assess the linearity of the assay, samples were spiked with high concentrations of human IGFBP-1 in various matrices and diluted with the Sample Diluent to produce samples with values within the dynamic range of the assay. | |||||||||||||
| Sample | Serum(n=4) | |||||||||||
1:1 | Average % | 95 | |||||||||||
Range % | 91-99 | ||||||||||||
1:2 | Average % | 96 | |||||||||||
Range % | 90-100 | ||||||||||||
1:4 | Average % | 98 | |||||||||||
Range % | 95-102 | ||||||||||||
1:8 | Average % | 97 | |||||||||||
Range % | 94-101 | ||||||||||||
The recovery of human IGFBP-1 spiked to levels throughout the range of the assay in various matrices was evaluated. Samples were diluted prior to assay as directed in the Sample Preparation section. | |||||||||||||
Sample Type | Average % Recovery | Range | |||||||||||
Serum (n=5) | 97 | 91-99 | |||||||||||
EDTA plasma (n=4) | 98 | 95-103 | |||||||||||
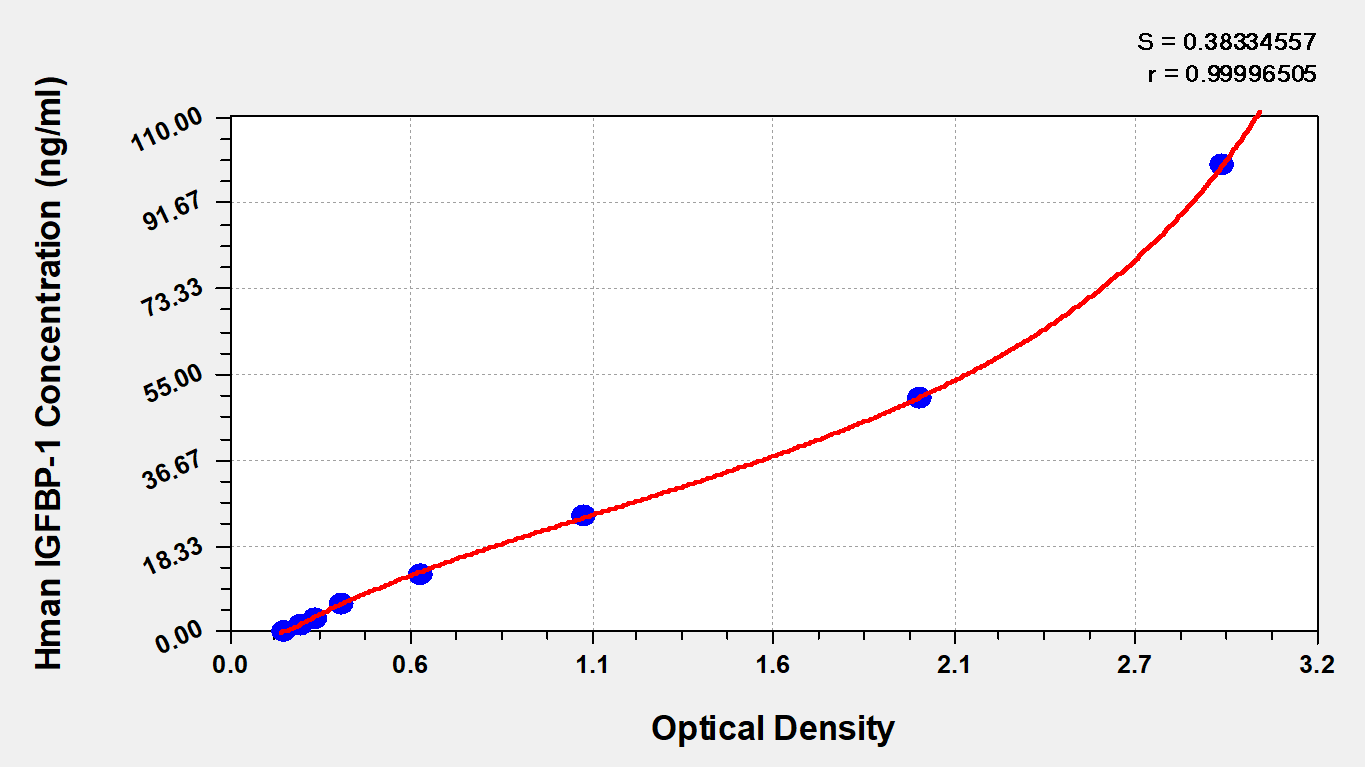
These standard curves are provided for demonstration only. A standard curve should be generated for each set of samples assayed. | |||||||||||||
| |||||||||||||
ng/ml | OD1 | OD2 | Average | Corrected | |||||||||
100 | 2.921 | 2.950 | 2.936 | 2.759 | |||||||||
50 | 2.017 | 2.073 | 2.045 | 1.868 | |||||||||
25 | 1.069 | 1.052 | 1.061 | 0.884 | |||||||||
12.5 | 0.585 | 0.574 | 0.580 | 0.403 | |||||||||
6.25 | 0.356 | 0.339 | 0.348 | 0.171 | |||||||||
3.12 | 0.272 | 0.261 | 0.267 | 0.090 | |||||||||
1.56 | 0.217 | 0.231 | 0.224 | 0.047 | |||||||||
0 | 0.178 | 0.176 | 0.177 |
| |||||||||
The product CSB-E04586h is a sandwich ELISA kit developed to measure concentrations of human IGFBP1 in serum, plasma, or tissue homogenates. This assay uses the sandwich enzyme immunoassay technique in combination with the enzyme-substrate chromogenic reaction to quantify the analyte in the sample. The color develops positively to the amount of IGFBP1 in samples. The color intensity is measured at 450 nm via a microplate reader.
IGFBP1 is produced dominantly in the liver, heart, and kidney. It binds to insulin-like growth factor (IGF) and regulates IGF actions in somatic growth, development, and aging. IGFBP-1 not only is an important determinant of IGF activity but also enhances glucose uptake in peripheral tissues and decreases glucose output in the liver. It regulates cell proliferation, migration, and glucose metabolism by activating integrin-ILK/FAK/PTEN signaling through integrin receptors on the cell membrane. Low circulating levels of IGFBP1 are related to insulin resistance and predict the development of type 2 diabetes. Dysregulation of IGFBP1, as well as IGFs in serum and cervical secretions, induces metabolic disease and cardiovascular disease. Overexpression of IGFBP1 has been shown to improve impaired glucose tolerance.
There are currently no reviews for this product.