Call us
301-363-4651 (Available 9 a.m. to 5 p.m. CST from Monday to Friday)
| Code | CSB-EQ027860MO |
| Size | 96T,5×96T,10×96T |
| Price | Request a Quote |
| Trial Size |
24T ELISA Kit Trial Size (Only USD$150/ kit) * Sample kit cost can be deducted as a $30 credit for each 96-assay kit of the same analyte and brand you subsequently purchase within six months until depleted. More details >> Interested in a trial size? Please leave a message below.
|
| Have Questions? | Leave a Message or Start an on-line Chat |
| Intra-assay Precision (Precision within an assay): CV%<8% | |||||||
| Three samples of known concentration were tested twenty times on one plate to assess. | |||||||
| Inter-assay Precision (Precision between assays): CV%<10% | |||||||
| Three samples of known concentration were tested in twenty assays to assess. | |||||||
| To assess the linearity of the assay, samples were spiked with high concentrations of mouse LDL-C in various matrices and diluted with the Sample Diluent to produce samples with values within the dynamic range of the assay. | |||||||
| Sample | Serum(n=4) | ||||||
| 1:100 | Average % | 86 | |||||
| Range % | 82-92 | ||||||
| 1:200 | Average % | 94 | |||||
| Range % | 91-98 | ||||||
| 1:400 | Average % | 107 | |||||
| Range % | 103-114 | ||||||
| 1:800 | Average % | 89 | |||||
| Range % | 85-94 | ||||||
| The recovery of mouse LDL-Cspiked to levels throughout the range of the assay in various matrices was evaluated. Samples were diluted prior to assay as directed in the Sample Preparation section. | |||||||
| Sample Type | Average % Recovery | Range | |||||
| Serum (n=5) | 88 | 84-93 | |||||
| EDTA plasma (n=4) | 91 | 87-95 | |||||
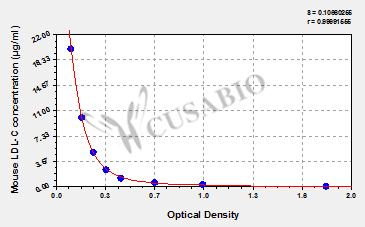
| These standard curves are provided for demonstration only. A standard curve should be generated for each set of samples assayed. | ||||||||||||||||||||||||||||||||||||||||||||||||||||||||||||||||||||||||
|
||||||||||||||||||||||||||||||||||||||||||||||||||||||||||||||||||||||||
The Mouse Low-Density Lipoprotein Cholesterol (LDL-C) ELISA Kit is a valuable tool for researchers working with mouse samples to quantify LDL-C levels. This kit is specifically designed for serum, plasma, and tissue homogenates from mice. It offers a wide detection range from 0.312 μg/mL to 20 μg/mL, with a high sensitivity of 0.078 μg/mL. The assay principle is quantitative, utilizing a competitive measurement approach. The assay can be completed within 1-5 hours, making it efficient for laboratory workflows. A small sample volume of 50-100 μL is required for analysis. The detection is read at a wavelength of 450 nm, ensuring accurate and reliable results. This ELISA kit has been utilized in multiple research papers, indicating its reliability and widespread acceptance within the scientific community.
Research on mouse models has been instrumental in understanding the pathophysiological mechanisms underlying atherosclerosis [1]. Studies have shown that LDL-C plays a significant role in the development of atherosclerosis, with LDL particles being taken up by macrophages through receptor-dependent and receptor-independent mechanisms, leading to the formation of foam cells, a hallmark of atherosclerotic plaques [2]. Additionally, interventions targeting cholesterol metabolism, such as blocking cholesterol absorption, have been shown to impact LDL-C levels in mice [3].
References:
[1] Y. Lee, H. Lin, Y. Chan, K. Li, O. To, B. Yanet al., "Mouse models of atherosclerosis: a historical perspective and recent advances", Lipids in Health and Disease, vol. 16, no. 1, 2017. https://doi.org/10.1186/s12944-016-0402-5
[2] H. Kruth, "Receptor-independent fluid-phase pinocytosis mechanisms for induction of foam cell formation with native low-density lipoprotein particles", Current Opinion in Lipidology, vol. 22, no. 5, p. 386-393, 2011. https://doi.org/10.1097/mol.0b013e32834adadb
[3] J. Repa, S. Turley, & G. Quan, "Delineation of molecular changes in intrahepatic cholesterol metabolism resulting from diminished cholesterol absorption", The Journal of Lipid Research, vol. 46, no. 4, p. 779-789, 2005. https://doi.org/10.1194/jlr.m400475-jlr200
There are currently no reviews for this product.