Call us
301-363-4651 (Available 9 a.m. to 5 p.m. CST from Monday to Friday)
| Code | CSB-E15930Fh |
| Size | 96T,5×96T,10×96T |
| Price | Request a Quote |
| Trial Size |
24T ELISA Kit Trial Size (Only USD$150/ kit) * Sample kit cost can be deducted as a $30 credit for each 96-assay kit of the same analyte and brand you subsequently purchase within six months until depleted. More details >> Interested in a trial size? Please leave a message below.
|
| Have Questions? | Leave a Message or Start an on-line Chat |
| Intra-assay Precision (Precision within an assay): CV%<8% | ||||||
| Three samples of known concentration were tested twenty times on one plate to assess. | ||||||
| Inter-assay Precision (Precision between assays): CV%<10% | ||||||
| Three samples of known concentration were tested in twenty assays to assess. | ||||||
| To assess the linearity of the assay, samples were spiked with high concentrations of fish GSH-PX in various matrices and diluted with the Sample Diluent to produce samples with values within the dynamic range of the assay. | ||||||
| Sample | Serum(n=4) | |||||
| 1:100 | Average % | 95 | ||||
| Range % | 91-99 | |||||
| 1:200 | Average % | 103 | ||||
| Range % | 99-107 | |||||
| 1:400 | Average % | 98 | ||||
| Range % | 93-103 | |||||
| 1:800 | Average % | 92 | ||||
| Range % | 87-97 | |||||
| The recovery of fish GSH-PX spiked to levels throughout the range of the assay in various matrices was evaluated. Samples were diluted prior to assay as directed in the Sample Preparation section. | ||||||
| Sample Type | Average % Recovery | Range | ||||
| Serum (n=5) | 99 | 94-104 | ||||
| EDTA plasma (n=4) | 89 | 84-94 | ||||
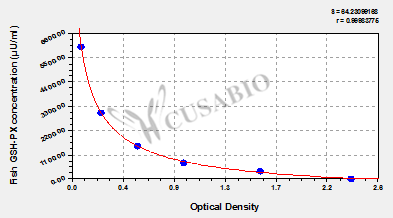
| These standard curves are provided for demonstration only. A standard curve should be generated for each set of samples assayed. | |||||||||||||||||||||||||||||||||||||||||||||||||
|
|||||||||||||||||||||||||||||||||||||||||||||||||
This Fish GSH-PX ELISA Kit was designed for the quantitative measurement of Fish GSH-PX protein in serum, plasma, tissue homogenates. It is a Competitive ELISA kit, its detection range is 375 μU/mL-6000 μU/mL and the sensitivity is 187.5 μU/mL.
There are currently no reviews for this product.