Call us
301-363-4651 (Available 9 a.m. to 5 p.m. CST from Monday to Friday)
| Code | CSB-E15846m |
| Size | 96T,5×96T,10×96T |
| Price | Request a Quote |
| Trial Size |
24T ELISA Kit Trial Size (Only USD$150/ kit) * Sample kit cost can be deducted as a $30 credit for each 96-assay kit of the same analyte and brand you subsequently purchase within six months until depleted. More details >> Interested in a trial size? Please leave a message below.
|
| Have Questions? | Leave a Message or Start an on-line Chat |
Intra-assay Precision (Precision within an assay): CV%<8% | |||||||||||||||||||||||||||||||||||||||||||||||||||||
Three samples of known concentration were tested twenty times on one plate to assess. | |||||||||||||||||||||||||||||||||||||||||||||||||||||
Inter-assay Precision (Precision between assays): CV%<10% | |||||||||||||||||||||||||||||||||||||||||||||||||||||
Three samples of known concentration were tested in twenty assays to assess. | |||||||||||||||||||||||||||||||||||||||||||||||||||||
| |||||||||||||||||||||||||||||||||||||||||||||||||||||
To assess the linearity of the assay, samples were spiked with high concentrations of mouse sLOX-1 in various matrices and diluted with the Sample Diluent to produce samples with values within the dynamic range of the assay. | |||||||||||
| Sample | Serum(n=4) | |||||||||
1:1 | Average % | 88 | |||||||||
Range % | 81-93 | ||||||||||
1:2 | Average % | 98 | |||||||||
Range % | 90-102 | ||||||||||
1:4 | Average % | 98 | |||||||||
Range % | 91-101 | ||||||||||
1:8 | Average % | 98 | |||||||||
Range % | 91-102 | ||||||||||
The recovery of mouse sLOX-1 spiked to levels throughout the range of the assay in various matrices was evaluated. Samples were diluted prior to assay as directed in the Sample Preparation section. | |||||||||||
Sample Type | Average % Recovery | Range | |||||||||
Serum (n=5) | 90 | 82-95 | |||||||||
EDTA plasma (n=4) | 99 | 91-104 | |||||||||
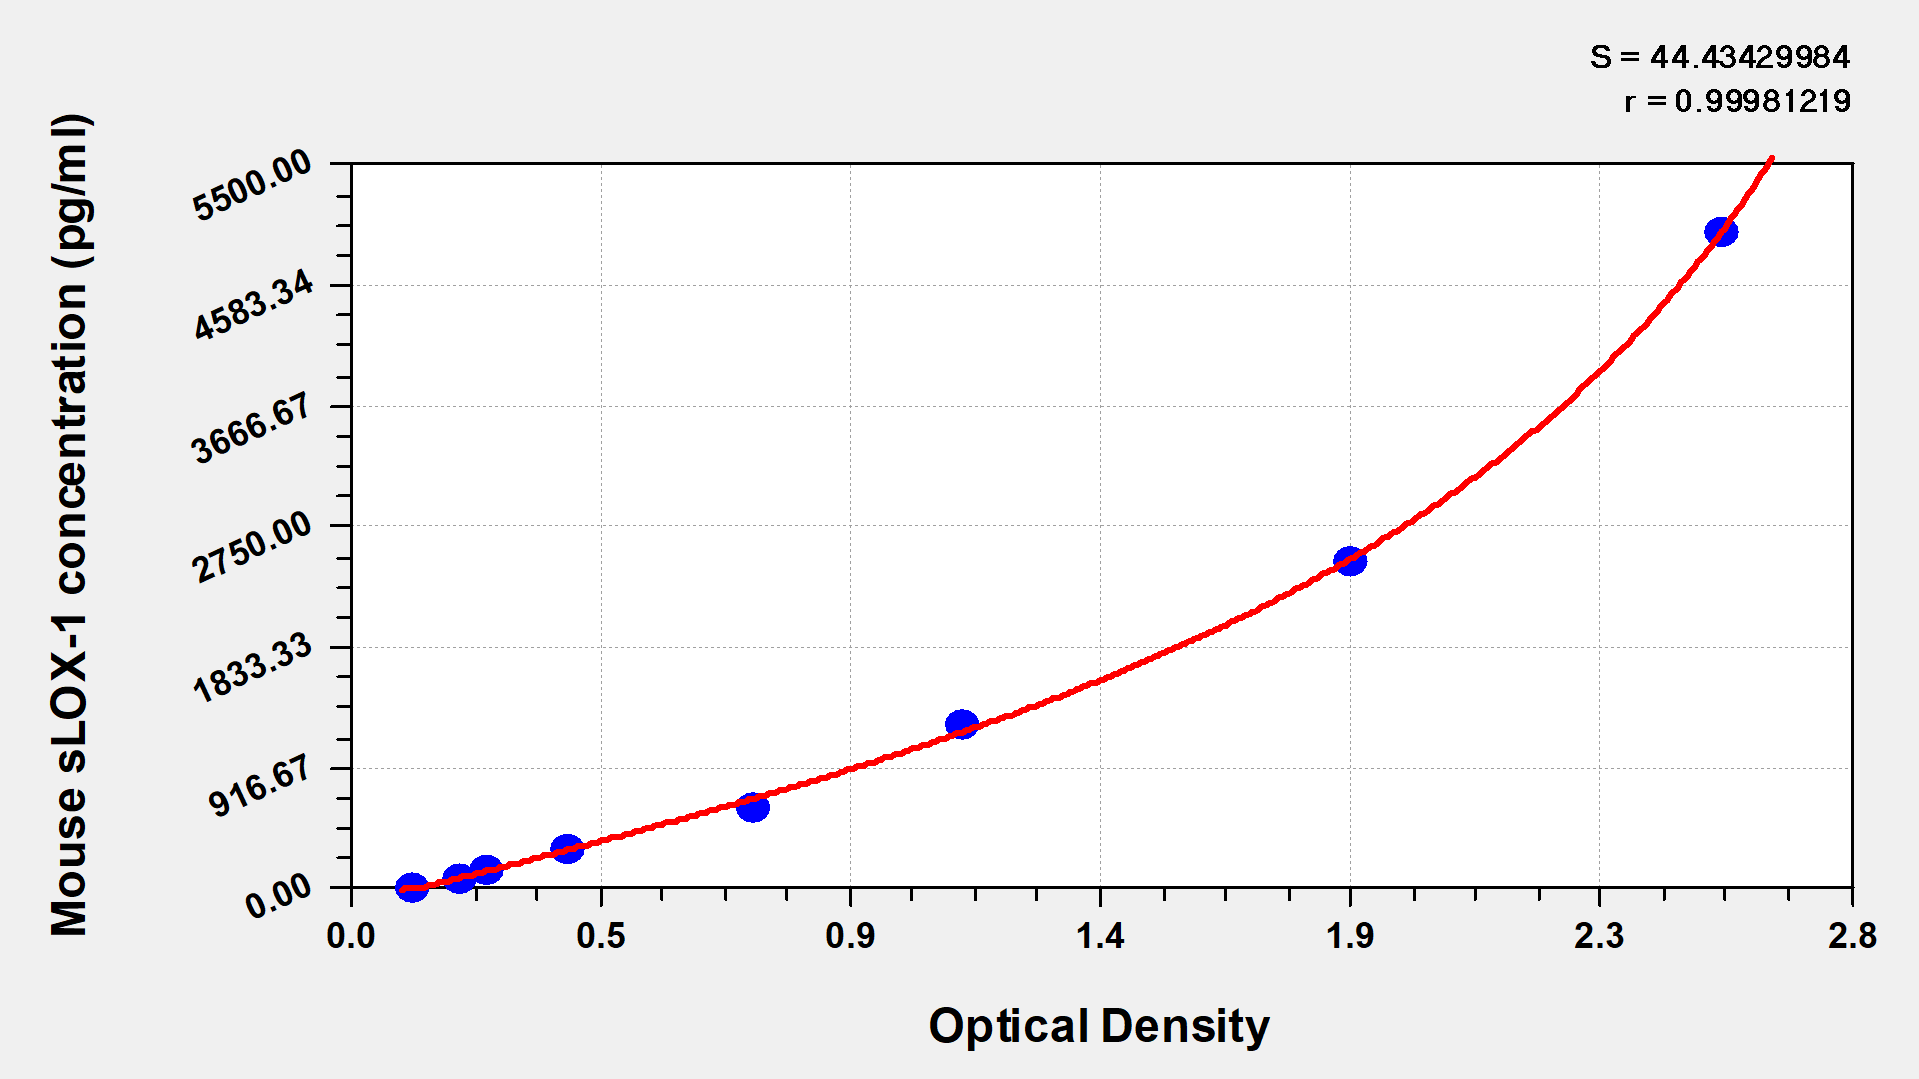
These standard curves are provided for demonstration only. A standard curve should be generated for each set of samples assayed. | |||||||||||
| |||||||||||
pg/ml | OD1 | OD2 | Average | Corrected | |||||||
5000 | 2.592 | 2.487 | 2.540 | 2.414 | |||||||
2500 | 1.837 | 1.876 | 1.857 | 1.731 | |||||||
1250 | 1.159 | 1.123 | 1.141 | 1.015 | |||||||
625 | 0.766 | 0.745 | 0.756 | 0.630 | |||||||
312 | 0.403 | 0.422 | 0.413 | 0.287 | |||||||
156 | 0.273 | 0.258 | 0.266 | 0.140 | |||||||
78 | 0.211 | 0.218 | 0.215 | 0.089 | |||||||
0 | 0.127 | 0.125 | 0.126 |
| |||||||
There are currently no reviews for this product.