Call us
301-363-4651 (Available 9 a.m. to 5 p.m. CST from Monday to Friday)
| Code | CSB-E04578m-IS |
| Size | 96T,5×96T,10×96T |
| Price | Request a Quote |
| Trial Size |
24T ELISA Kit Trial Size (Only USD$150/ kit) * Sample kit cost can be deducted as a $30 credit for each 96-assay kit of the same analyte and brand you subsequently purchase within six months until depleted. More details >> Interested in a trial size? Please leave a message below.
|
| Have Questions? | Leave a Message or Start an on-line Chat |
Intra-assay Precision (Precision within an assay): CV%<8% | ||||||
Three samples of known concentration were tested twenty times on one plate to assess. | ||||||
Inter-assay Precision (Precision between assays): CV%<10% | ||||||
Three samples of known concentration were tested in twenty assays to assess. | ||||||
To assess the linearity of the assay, samples were spiked with high concentrations of mouse IFN-γ in various matrices and diluted with the Sample Diluent to produce samples with values within the dynamic range of the assay. | ||||||
| Sample | Serum(n=4) | ||||
1:1 | Average % | 93 | ||||
Range % | 89-98 | |||||
1:2 | Average % | 97 | ||||
Range % | 90-104 | |||||
1:4 | Average % | 91 | ||||
Range % | 85-96 | |||||
1:8 | Average % | 101 | ||||
Range % | 94-108 | |||||
The recovery of mouse IFN-γ spiked to levels throughout the range of the assay in various matrices was evaluated. Samples were diluted prior to assay as directed in the Sample Preparation section. | ||||||
Sample Type | Average % Recovery | Range | ||||
Serum (n=5) | 89 | 85-95 | ||||
EDTA plasma (n=4) | 97 | 91-103 | ||||
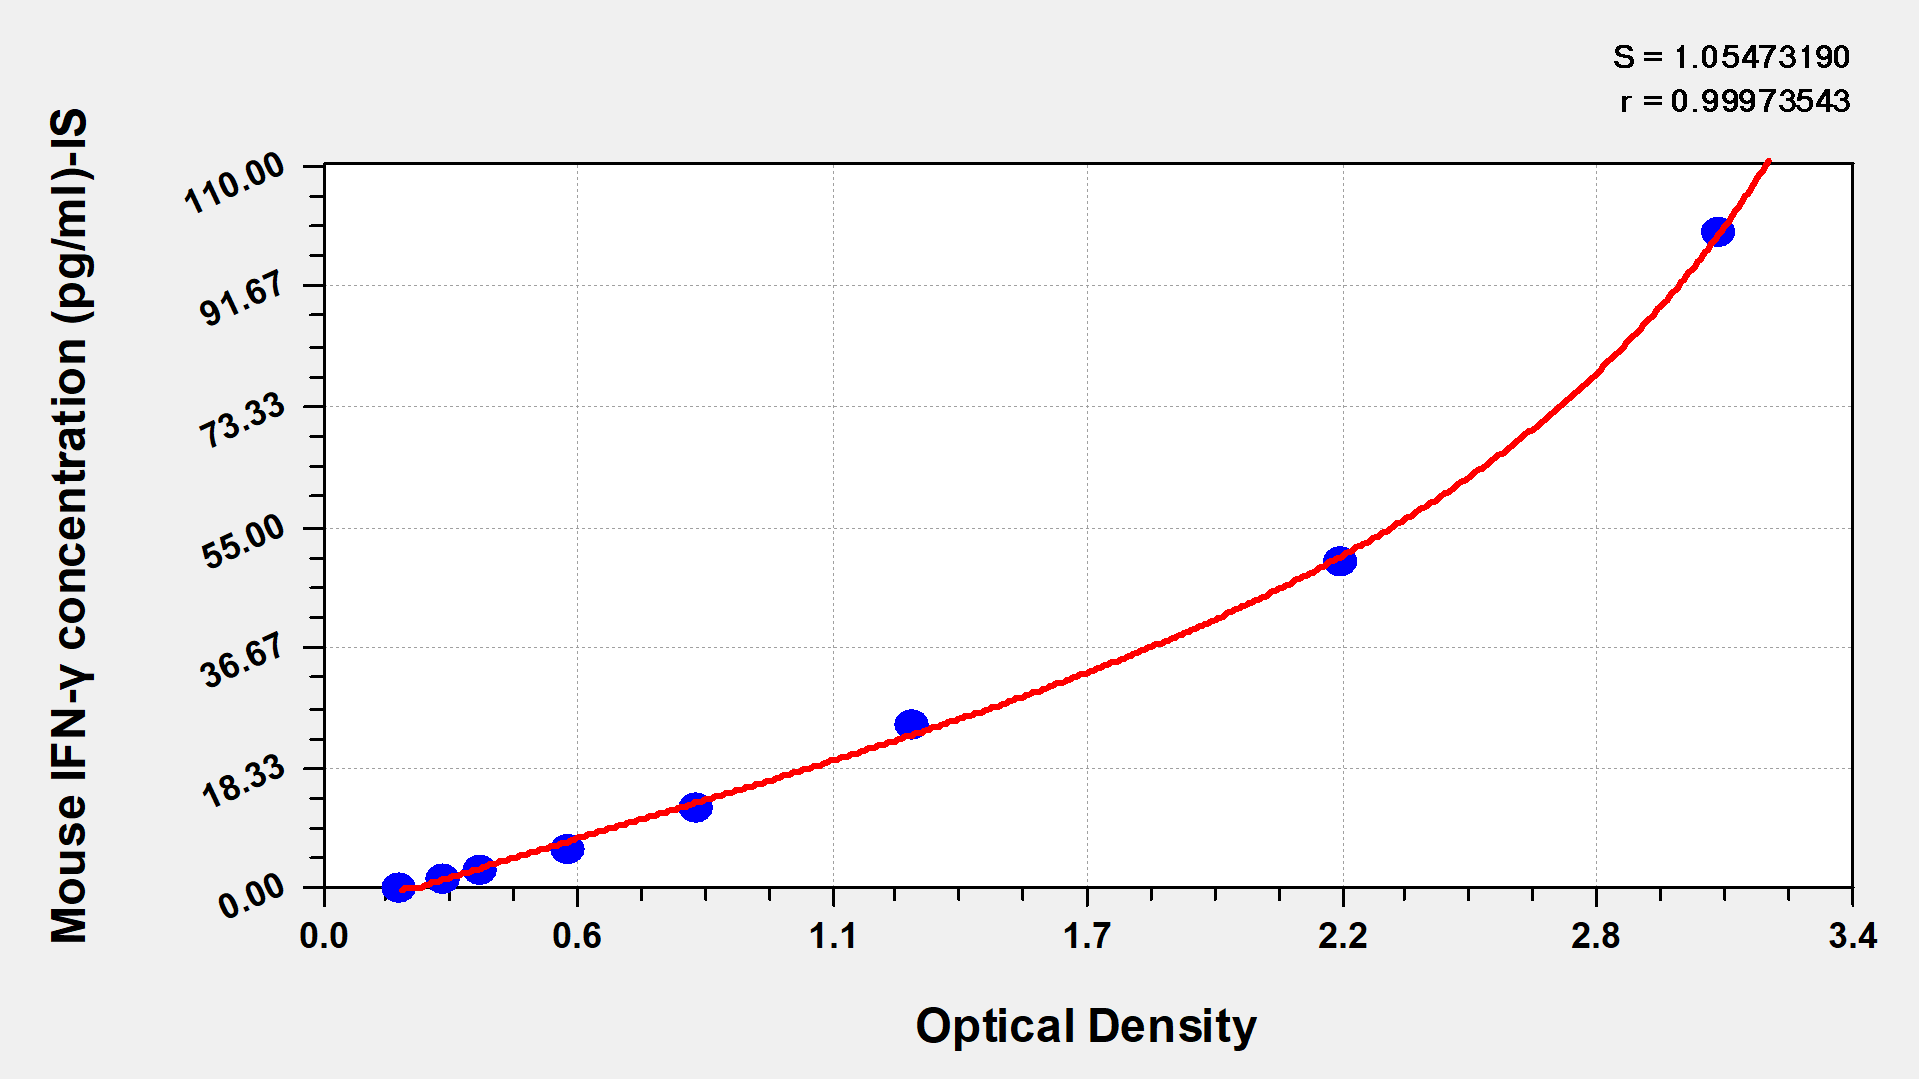
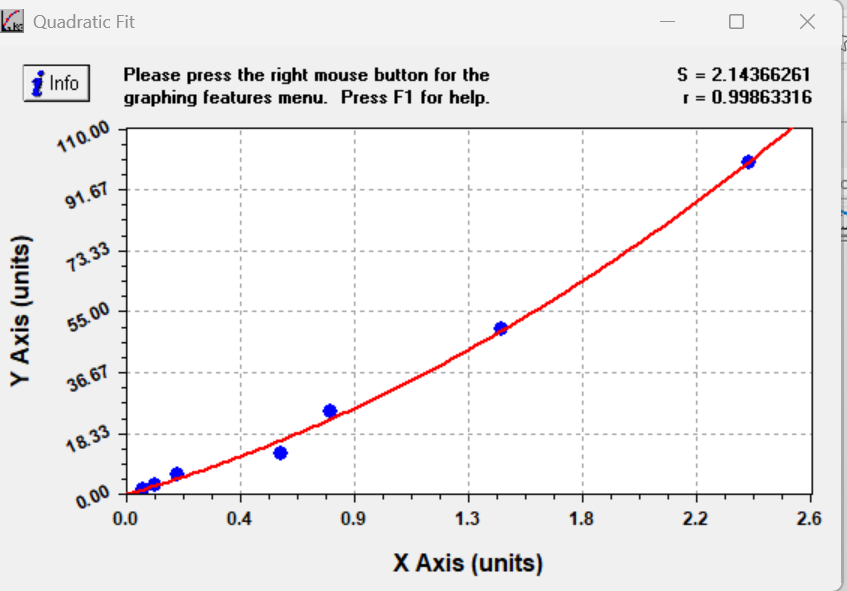
These standard curves are provided for demonstration only. A standard curve should be generated for each set of samples assayed. | |||||||
| |||||||
pg/ml | OD1 | OD2 | Average | Corrected | |||
100 | 3.000 | 3.134 | 3.067 | 2.880 | |||
50 | 2.297 | 2.178 | 2.238 | 2.051 | |||
25 | 1.259 | 1.348 | 1.303 | 1.116 | |||
12.5 | 0.838 | 0.829 | 0.834 | 0.647 | |||
6.25 | 0.537 | 0.561 | 0.549 | 0.362 | |||
3.12 | 0.367 | 0.353 | 0.360 | 0.173 | |||
1.56 | 0.285 | 0.274 | 0.280 | 0.093 | |||
0 | 0.189 | 0.185 | 0.187 |
| |||
This kit provides quantitative measurement of interferon-gamma (IFN-γ) in mouse samples, supporting immunological research into Th1-mediated responses, infection, and inflammatory disease. Because IFN-γ is often produced transiently and at low concentrations—particularly in unstimulated or early-phase immune responses—this kit is designed to capture biologically meaningful differences across diverse experimental conditions.
Detection Range: The 1.56–100 pg/ml range aligns with physiological IFN-γ levels in mouse serum and stimulated splenocyte supernatants, where concentrations typically fall in the low-to-mid pg/ml range. Samples from strongly activated T cells or NK cells (e.g., anti-CD3/CD28 stimulation, LCMV infection models) may require dilution to remain within range.
Sensitivity: At 0.39 pg/ml, the kit detects IFN-γ in low-abundance contexts such as naïve mouse serum, early post-infection time points, or conditioned media from small numbers of sorted Th1 or CD8⁺ T cells.
Sample Compatibility: Validation across serum, plasma, tissue homogenates, and cell culture supernatants enables paired in vivo/ex vivo study designs—for example, correlating splenic homogenate levels with circulating IFN-γ or restimulation assay readouts.
Assay Efficiency: The 1–5 hour protocol and 50–100 µl sample volume accommodate experiments constrained by limited primary cell yields or small-volume bleeds from longitudinal mouse studies.
This kit is directly applicable to studies of intracellular infection clearance, graft rejection, and Th1/Th2 polarization.
Sample type: Serum
Sample species: Mouse
Sample dilution: 1:10
Review: I used CSB-E04578m-IS to detect interferon-γ in the serum of mice. I bought the ornate kit for the first time and followed the instructions step by step to operate. Finally, the results did not get the desired statistical difference, but there was a corresponding trend, and we still need to do further verification. Tell me some feelings about this kit. 1. The description is particularly detailed and can be made step by step. It is relatively simple, but the reagent is written in English name. Before you use it, you must determine which is which, don\'t worry about using it wrong. 2. Biotin-labeled antibody and horseradish peroxidase labeled avidin are relatively few, so we should pay special attention when adding samples, especially accurate! It is better to vortex the vortex attached to the wall at the beginning. When I added it, I made 48 samples, and I think I used 2/3 of the two samples. Next time, I will have to contact the customer service here to see if I can add 3. The standard curve in the final result is very good, and the R square is greater than 0.99, but there are some large differences within my group, which may be related to the washing plate operation. I\'ll have to try again recently, but the trend in my six groups as a whole is definitely visible. Some information on the official website is really good, the standard curve processing software is also very professional, but it is possible to input x one by one to get the y value, this is relatively large. You must watch the video and instructions before you do it, don\'t just do it!! Touch the dilution concentration and do a pre-experiment at the same time. I hope I can get good results next! Also hope you can have good experimental results!! Come on, researchers!
By Anonymous