Call us
301-363-4651 (Available 9 a.m. to 5 p.m. CST from Monday to Friday)
The Cancer Genome Atlas (TCGA) is a project collaboratively monitored by the National Cancer Institute (NCI) and the National Human Genome Research Institute in the United States (NHGRI) that has generated comprehensive, multi-dimensional maps of the key genomic changes in 33 types of cancer. It aims to apply high-throughput Genomic analysis techniques to help people have a better understanding of cancer, thereby improving the prevention, diagnosis, and treatment of cancer. Here, we combine the information of TCGA Database in following aspects, including the types of data, the methods of downloading data, and the analytical tools for TCGA base.
Five factors of TCGA Database
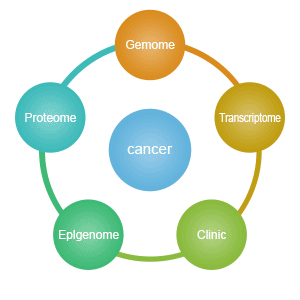
As the largest database of cancer gene information, TCGA dataset not only contains many cancer types, but also multi-omics data, involving gene expression data, miRNA expression data, copy number variation, DNA methylation, SNP, and Compared with the GEO database. Many researchers feel that the biggest advantage of TCGA is rich and standardized clinical data, as well as a large sample size for each cancer type. And the help of their studies is irresistible. In this section, we will introduce TCGA Data from two facets.
TCGA Data has three levels, including level 1, level 2, and level 3. Level 1 refers to primary sequence data with fasta and fastq form. Level 2 is bam form file with a good comparison. Level 3 is defined as a series of data by standardization. Among of the three levels data, levle1/2 is controlled-access, and the data of level 3 is partly controlled-access. Generally, if you want to visit the controlled-access data, you should have an application on the TCGA official website. But most ordinary users can only access parts of the level3 processing and standardized data. You can click here to know more information of data types.
As the section of levels mentioned, there are two kinds of data, controlled-access and opened data. Controlled-access data involves personal information, including primary sequence data (BAM and FASTQ files), SNP6 array level 1 and level 2 data, exon array level 1 and level 2 data, VCFs and certain information in MAFs. Conversely, it is easy to acquire the type of opened data, because it doesn't contain personal information. The opened data includes de-identified clinical and demographic data, gene expression data, copy number alterations in regions of the genome, epigenetic data, summary of data compiled across individuals and anonymized single amplicon DNA sequence data.
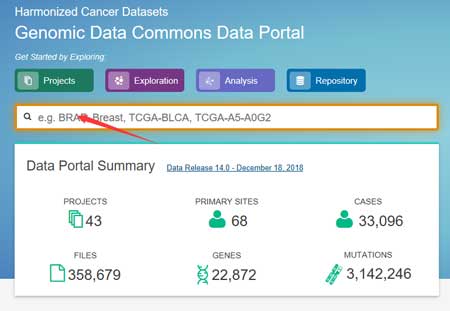
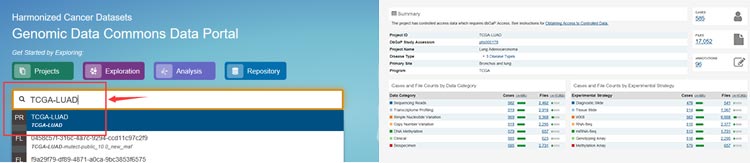
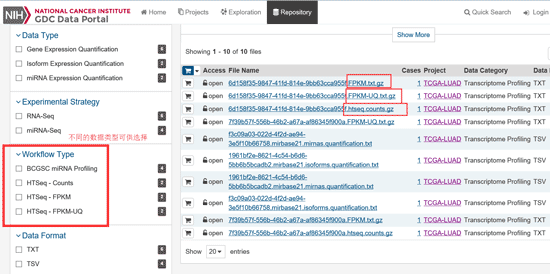
In order to download data from TCGA data portal, many sweet guys invent several methods. Here, we introduce two methods, one is the most common method to download data from TCGA official data-portal (https://portal.gdc.cancer.gov/), another is Firehose server (http://gdac.broadinstitute.org/).
Compared other methods, you can acquire the most complete and the fastest update data. But, if you download RNA data for one cancer, you can download hundreds of files, because each sample is a separate file. This can cause problems for later data analysis. We will describe this method step by step.
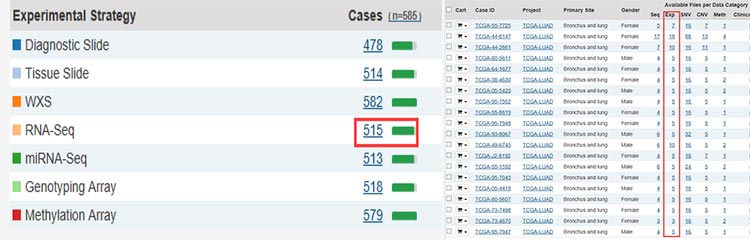
If you need RAW data such as FASTQ files you have find level 1 data, but often this kind of data is not publicly available on TCGA and you might need to ask for permission in order to download it.
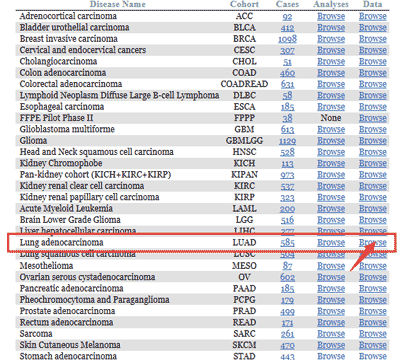
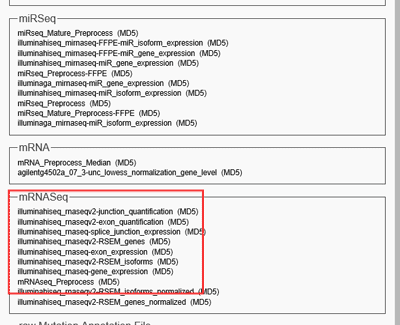
Compared the former method, the data also comes from portal.gdc.cancer.gov, but combines the same cancer, the same type of data together, super easy, one click to download, no need to merge data. However, it should be noted that the data collected by Firehose is not the data that TCGA updates in real time. You can download these data with following steps.
Besides the two ways download TCGA data, there also have many other useful tools for TCGA data download and analysis. Here, we list several tools for mining TCGA official web data with high score from researches.
cBioPortal (http://www.cbioportal.org/) is a powerful tool developed by the MemorialSloan-Kettering Cancer Center. When it comes to TCGA analysis tools, cBioPortal provides visualization, analysis, and download of large-scale cancer genomics data sets for Cancer Genomics, it is being a holy grail for everyone.
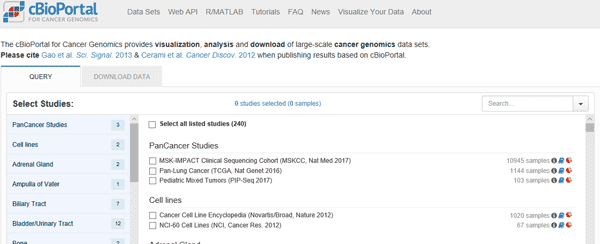
Using cBioPortal one can inspect the enrichment of certain genes, gene groups, mutations or alterations in different cancers, and associate these with certain clinical attributes and survival. The site allows the creation of a unique output type called 'oncoprint' to visually showcase these analyses. One can also use cBioPortal to predict co-expression of genes or mutations and observed networks for genes related to certain alteration. This great functionality and frequent updates make this tool a prime selection for beginners as well as advanced users exploring TCGA data.
MEXPRESS (https://mexpress.be/?ref=labworm) is a data visualization tool designed for the easy visualization of TCGA expression, DNA methylation and clinical data, as well as the relationships between them. Moreover, it keeps things simple and intuitive – select a study and a single gene of interest and obtain a wealth of information arranges in a clear and minimalist interface, as the follow figure shows.
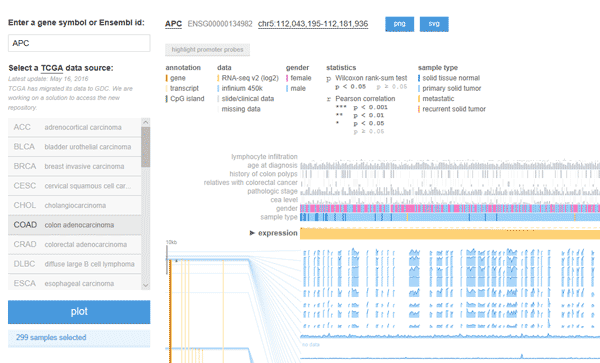
This tool shows the expression of the chosen gene across TCGA tumor samples, alongside clinical data and DNA methylation of the gene region that could illustrate important trends. One can also sort the data according to these different parameters and evaluate their statistical correlation with gene expression.
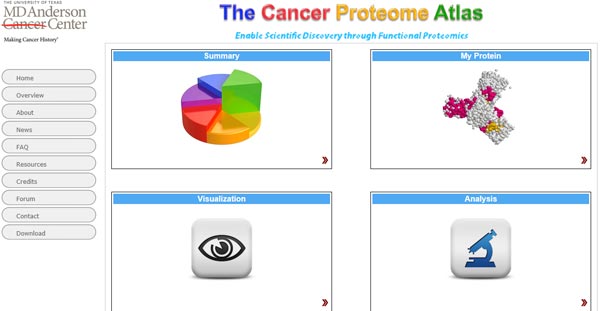
The Cancer Proteome Atlas (TCPA: https://www.tcpaportal.org/tcpa/) is a website developed by the MD Anderson Cancer Center for downloading TCGA proteomics data, mining visualizations. It contains two parts of data, Patient Cohorts and Cancer Cell Lines. Patient Cohorts is a comprehensive resource for accessing, visualizing, and analyzing functional proteomics of patient tumor samples. Cancer Cell Lines is a comprehensive resource for accessing, visualizing, and analyzing functional proteomics of cancer cell lines.
The current data release contains ~8,000 samples of 32 TCGA cancer types and another ~500 samples of independent patient cohorts. The current app contains both analysis and visualization modules. Additionally, you can click the following link to know more things about how to do Data Analysis: https://www.tcpaportal.org/tutorials.html.
TCGA2STAT enables users to easily download TCGA data directly into a format ready for statistical analysis in the R environment. The package imports and processes both molecular profiles and clinical data for more than 30 cancer types profiled with different high-throughput platforms. The data imported by this package is the version-stamped standardized data sets hosted and maintained by the Broad Institute GDAC Firehose. All imported data will be the latest version available from Firehose; typically, this is the aggregated Level 3 data from all sample batches and public clinical data as available from TCGA Data Portal. This tool has somewhat of a learning curve, and requires knowhow in R, yet it allows to streamline and conduct a robust analysis while keeping the datasets updated. You can click this link to know more details: http://www.liuzlab.org/TCGA2STAT/?ref=labworm.
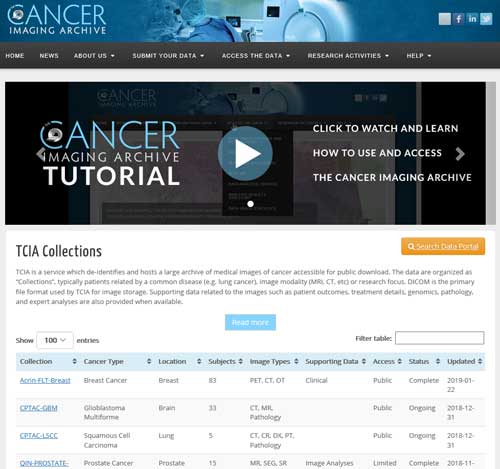
The Cancer Imaging Archive (TCIA) is a service which de-identifies and hosts a large archive of medical images of cancer accessible for public download. The data are organized as "Collections", imaging data from TCGA patients, such as MRI, CT, etc., stored in DICOM file format, and provides information related to patient outcomes, treatment details, genomics, pathology, and expert analysis. You can click this link to know more details: http://www.cancerimagingarchive.net/.
Finally, besides these tools, there are several least common tools for TCGA data analysis. They don't have the same type of data for analysis, you can choose according to the type of data you download.
FunSeq2 (https://github.com/khuranalab/FunSeq2_DC) is a tool developed by Weill Cornell Medicine to explore both mutated and non-coding variants, with multiple tumor genomic data as background.
MBatch (https://bioinformatics.mdanderson.org/tcgambatch/) is a web-based tool developed by MD Anderson Cancer Center to identify and quantify the batch effects present in processed TCGA data, supporting hierarchical clustering analysis and enhanced PCA analysis.
Cancer Regulome Tools & Data (http://explorer.cancerregulome.org/) is a web-based interactive tool developed by Center for Systems Analysis of the Cancer Regulome to visualize and explore the association between clinical and molecular TCGA data.
SurvNet (https://bioinformatics.mdanderson.org/survnet/) is a web-based tool developed by Anderson Cancer Center to identify web-based biomarkers associated with patient survival data.
Copy Number Portal (http://portals.broadinstitute.org/tcga/home) is a website developed by the famous Broad Institute for exploring TCGA data copy number variations, supports GISTIC analysis. This portal is designed to facilitate the use and understanding of high resolution copy number data amassed from cancer samples in the TCGA. All data in this portal were generated at the Broad Institute TCGA Genome Characterization Center. This portal is modeled after Tumorscape which contains copy number data from non-TCGA projects.
TumorMap (https://tumormap.ucsc.edu/), a powerful data mining tool developed by UC Santa Cruz, is an interactive browser that allows biologists, who may not have computational expertise, to richly explore the results of high-throughput cancer genomics experiments on thousands of patient samples.
Xena (https://xena.ucsc.edu/) is a powerful tools which collects data downloads and mining in one for visualization.


Comments
Leave a Comment