Call us
301-363-4651 (Available 9 a.m. to 5 p.m. CST from Monday to Friday)
| Code | CSB-E09623h |
| Size | 96T,5×96T,10×96T |
| Price | Request a Quote |
| Trial Size |
24T ELISA Kit Trial Size (Only USD$150/ kit) * Sample kit cost can be deducted as a $30 credit for each 96-assay kit of the same analyte and brand you subsequently purchase within six months until depleted. More details >> Interested in a trial size? Please leave a message below.
|
| Have Questions? | Leave a Message or Start an on-line Chat |
Intra-assay Precision (Precision within an assay): CV%<8% | ||||||||||||||||||||||||||||||||||||||||||||||||||||||
Three samples of known concentration were tested twenty times on one plate to assess. | ||||||||||||||||||||||||||||||||||||||||||||||||||||||
Inter-assay Precision (Precision between assays): CV%<10% | ||||||||||||||||||||||||||||||||||||||||||||||||||||||
Three samples of known concentration were tested in twenty assays to assess. | ||||||||||||||||||||||||||||||||||||||||||||||||||||||
| ||||||||||||||||||||||||||||||||||||||||||||||||||||||
To assess the linearity of the assay, samples were spiked with high concentrations of human Trypsin-2 in various matrices and diluted with the Sample Diluent to produce samples with values within the dynamic range of the assay. | ||||||||||||
| Sample | Serum(n=4) | ||||||||||
1:1 | Average % | 92 | ||||||||||
Range % | 87-98 | |||||||||||
1:2 | Average % | 98 | ||||||||||
Range % | 93-104 | |||||||||||
1:4 | Average % | 84 | ||||||||||
Range % | 82-88 | |||||||||||
1:8 | Average % | 90 | ||||||||||
Range % | 85-97 | |||||||||||
The recovery of human Trypsin-2 spiked to levels throughout the range of the assay in various matrices was evaluated. Samples were diluted prior to assay as directed in the Sample Preparation section. | ||||||||||||||
Sample Type | Average % Recovery | Range | ||||||||||||
Serum (n=5) | 95 | 89-99 | ||||||||||||
EDTA plasma (n=4) | 96 | 90-102 | ||||||||||||
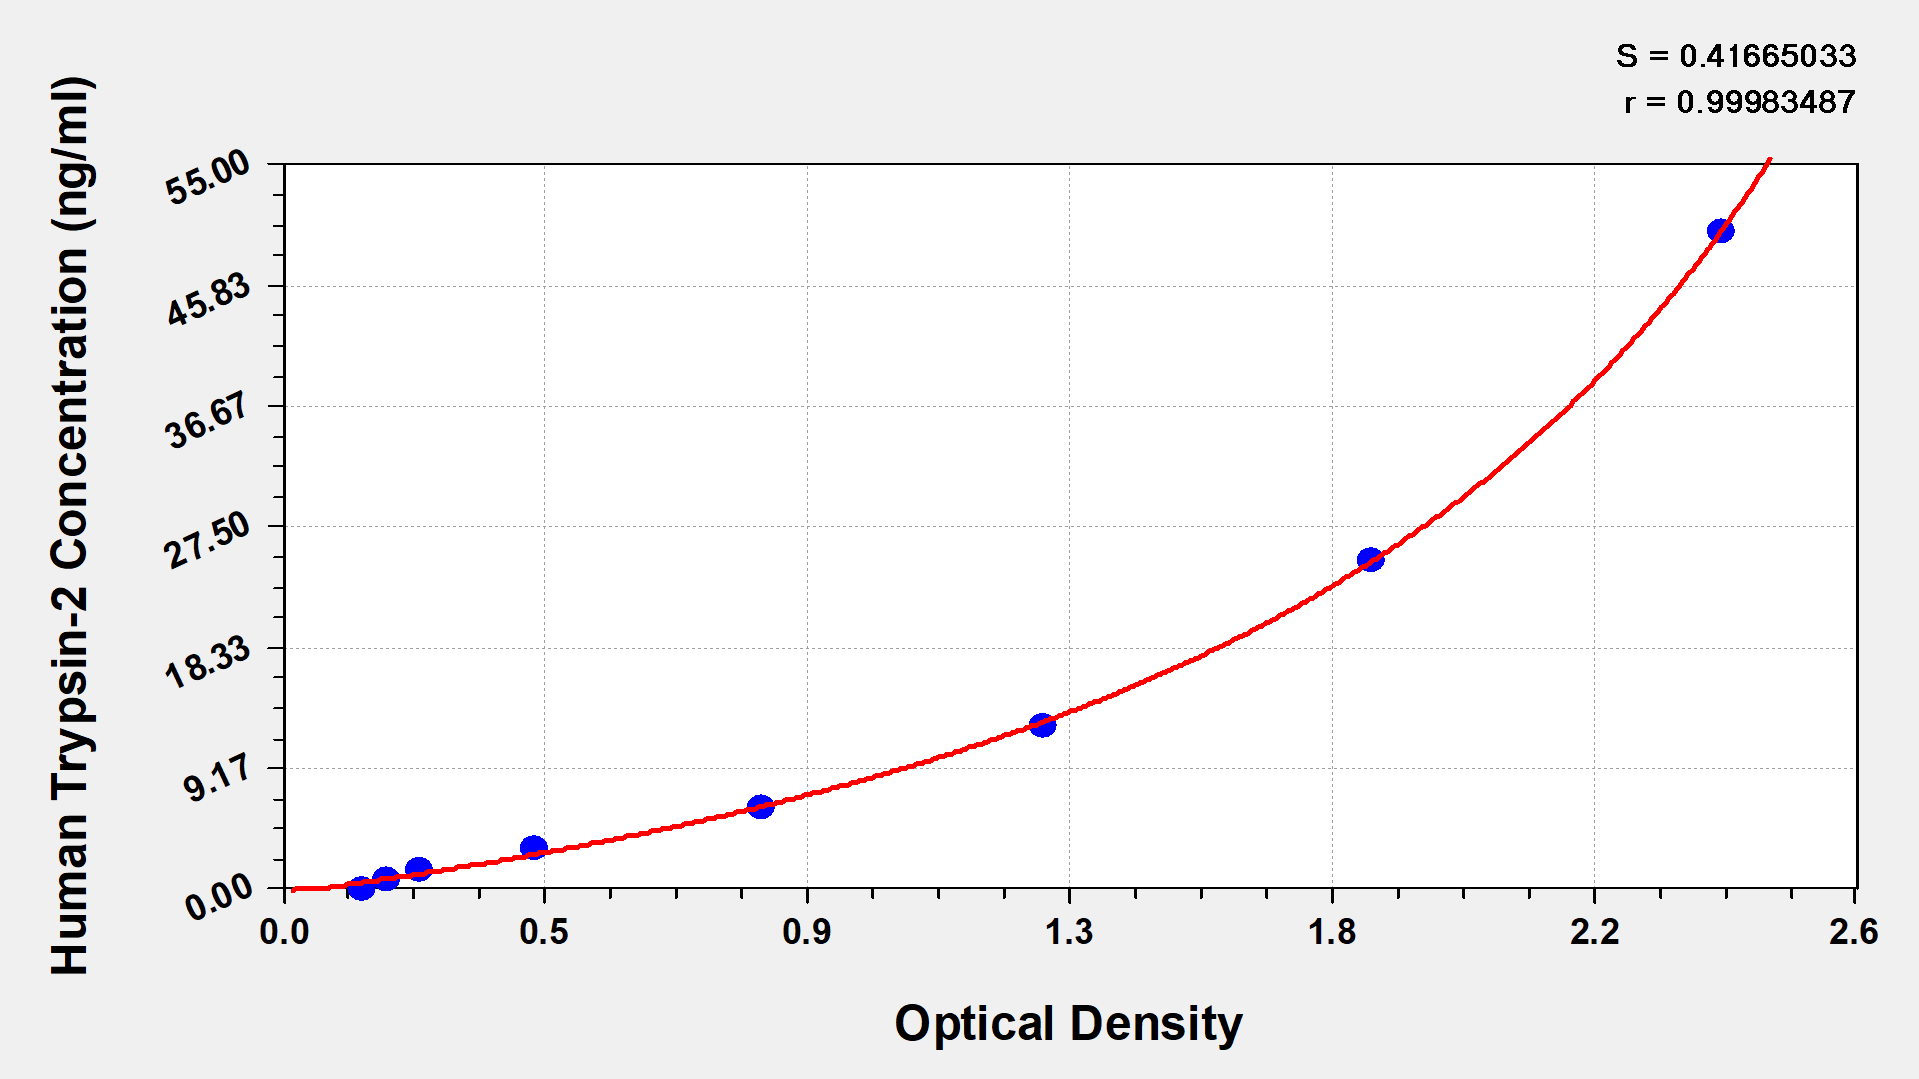
These standard curves are provided for demonstration only. A standard curve should be generated for each set of samples assayed. | ||||||||||||||||
| ||||||||||||||||
ng/ml | OD1 | OD2 | Average | Corrected | ||||||||||||
50 | 2.432 | 2.389 | 2.411 | 2.265 | ||||||||||||
25 | 1.822 | 1.831 | 1.827 | 1.681 | ||||||||||||
12.5 | 1.276 | 1.281 | 1.279 | 1.133 | ||||||||||||
6.25 | 0.819 | 0.804 | 0.812 | 0.666 | ||||||||||||
3.12 | 0.431 | 0.434 | 0.433 | 0.287 | ||||||||||||
1.56 | 0.234 | 0.243 | 0.239 | 0.093 | ||||||||||||
0.78 | 0.189 | 0.184 | 0.187 | 0.041 | ||||||||||||
0 | 0.149 | 0.142 | 0.146 | |||||||||||||
There are currently no reviews for this product.