Call us
301-363-4651 (Available 9 a.m. to 5 p.m. CST from Monday to Friday)
The signal pathway was first known as signal transmission. M. Rodbell proposed the concept of signal transduction in 1980 and has since been widely used.
Signaling pathways refer to a series of enzymatic reaction pathways that can transmit extracellular molecular signals through the cell membrane to play a role in cells.
In general, the common molecular types in the pathway: ligands and receptors, kinases/phosphatases (de/ubiquitinating enzymes) and substrates, transcription factors, and target genes. Among them, ligands include hormones, growth factors, cytokines, neurotransmitters, and other small molecule compounds.
Signaling pathways including metabolic pathway (e.g. tricarboxylic acid cycle), gene regulation pathway (such as loss of gene amplification) and signal transduction pathway (G protein mediated cell signal transduction pathways). What we usually talk about is the signal transduction pathway.
1. Introduction to KEGG Database
2. How to Inquiry Signal Pathway in KEGG Databases
3. How to Use Signal Pathway Image for Research?
4. How to Determine Which Signaling Pathways Genes Participate in?
The full name of KEGG is the Kyoto Encyclopedia of Genes and Genomes. It's web site is http://www.genome.jp/kegg/.
It is a bioinformatics database established in 1995 by Minoru Kanehisa (Professor at the Institute for Chemical Research, Kyoto University), under the then ongoing Japanese Human Genome Program [1].
The database mainly includes signal pathways, genes, diseases, drugs and chemical substances.
The genomic information of this database is mainly obtained from databases such as NCBI. Maintenance staff will update the database information regularly based on some new authoritative papers and laboratory data.
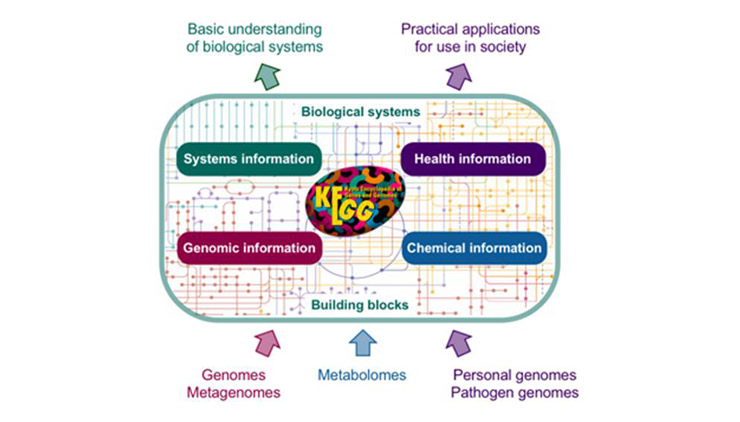
Figure 1 KEGG Overview
How to inquiry signal pathway in this database? There are the following steps:
1. First, open the KEGG homepage, its URL is https://www.kegg.jp/. Its main page is shown in Figure 2. Click on the “KEGG pathway” link at number 1 in Figure 2 and the page shown in Figure 3 will appear.
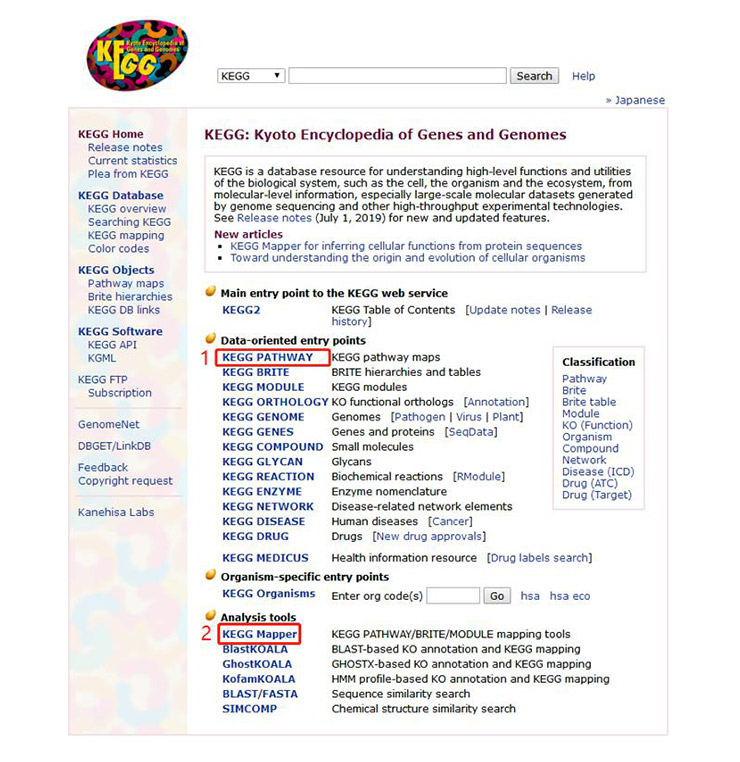
Figure 2 The homepage of KEGG
2. As shown in Figure 3, we can see that all signal paths are divided into six categories:
This page shows the details of the signaling pathways involved in these six types of data. Figure 4 shows only a small portion of the data.
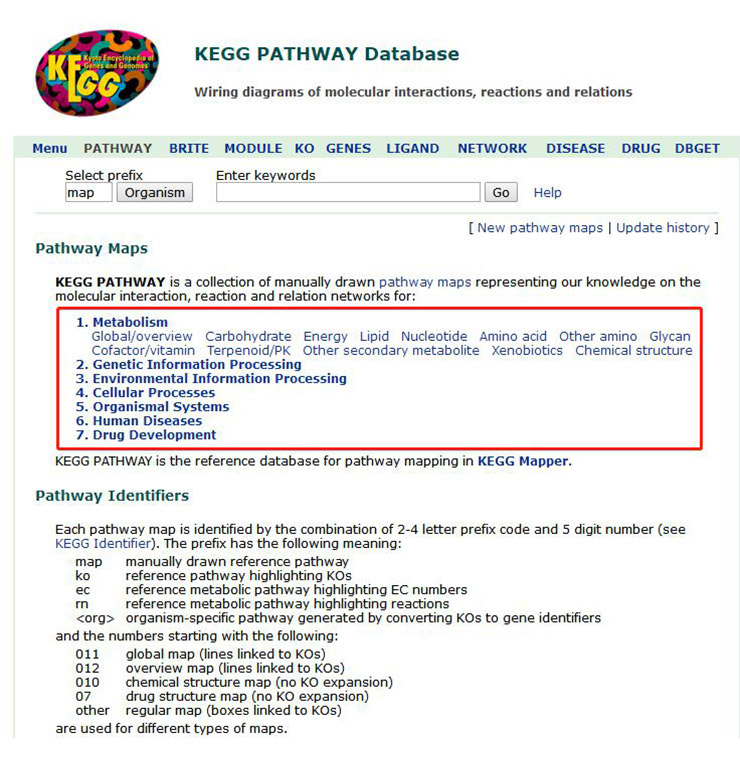
Figure 3 Classification of the KEGG signal path database
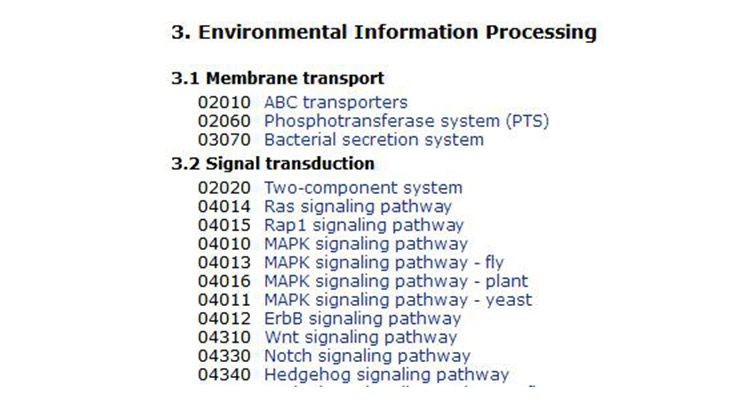
Figure 4 Detailed classification of signal pathways
3. Enter the signal path keywords in the search box according to your needs. The keyword can be the following:
Here, we take the p53 signaling pathway as an example to explain. After entering p53, click “GO” (as shown in Figure 5), and the result page will appear. When searching for a certain gene, the species can also be defined. The more commonly used human is hsa, and the mouse is mmu, which can narrow the scope of the query.
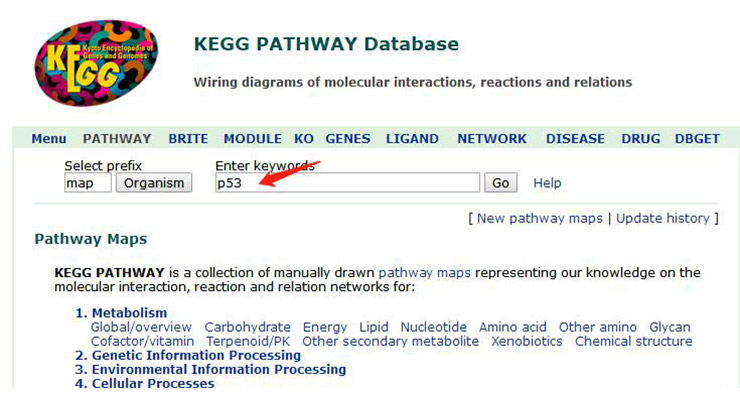
Figure 5 Search page for KEGG pathway database
4. On the results page, we can get the relevant signal pathway (Figure 6). Generally speaking, the signal pathway we are interested in will be displayed in the first position, while the latter signal pathway is mostly the interaction of the destination pathway and other pathways.
Click the “map04115” in Entry column, and you can see the description, classification and Thumbnail Image of the p53 signaling pathway (Figure 7). Click the Thumbnail Image to browse the global map of the signaling pathway (the global map of the signaling pathway can also be opened by clicking the Thumbnail Image in Figure 6). In addition, this page also includes diseases involved in the signaling pathway and some references.
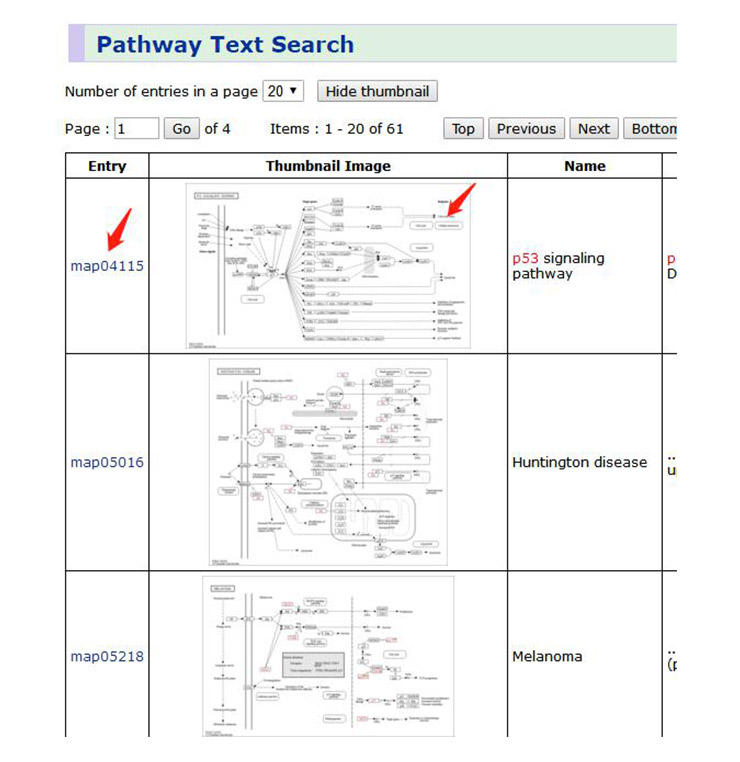
Figure 6 p53 and related signaling pathways
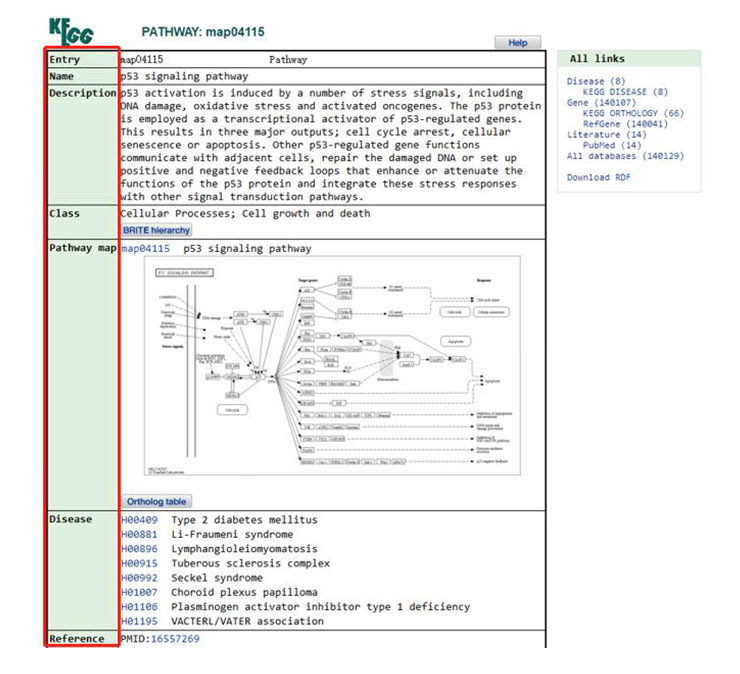
Figure 7 A detailed description of the p53 signaling pathway
5. The global map opened by clicking on the thumbnail is the signal pathway image we need. The gene and pathway names we entered will be displayed in red. As shown in Figure 8 (For a clearer display, only part of the signal pathway is cut).
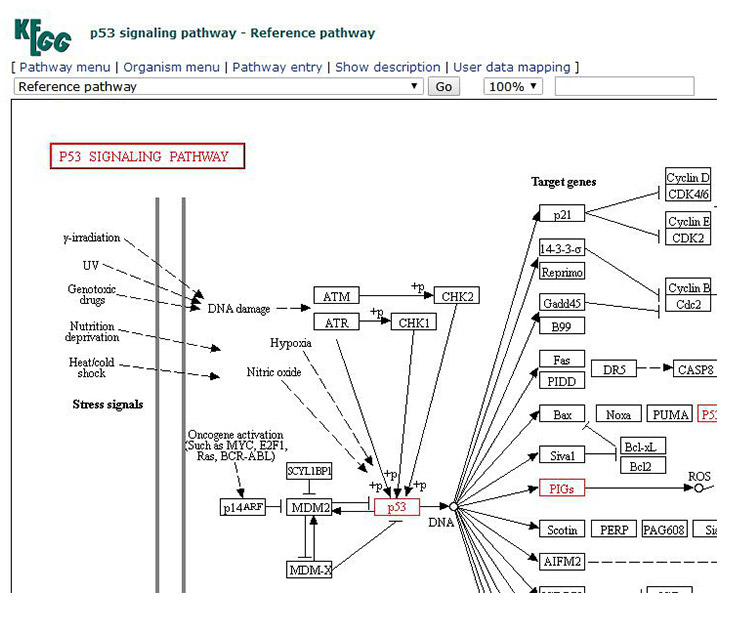
Figure 8 Display of p53 signaling pathway image
By observing the signal path image, you will find a large number of markers in the global map of the signal pathway, such as arrows, circles, etc. (Figure 8). To understand the meaning of these symbols, click on the “Help” (Figure 9) in the upper right corner of the signal pathway page. A new page will appear, which has a detailed description of the various markers (Figure 10).
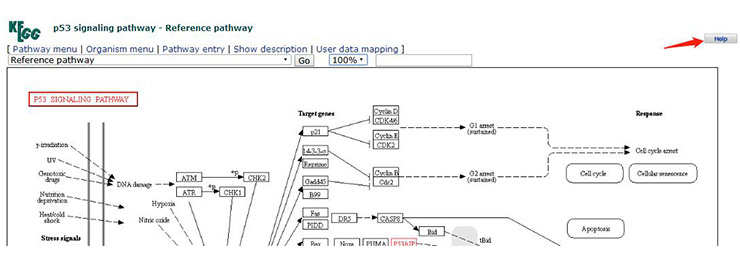
Figure 9 How to find the meaning of the markers in the KEGG signaling pathway
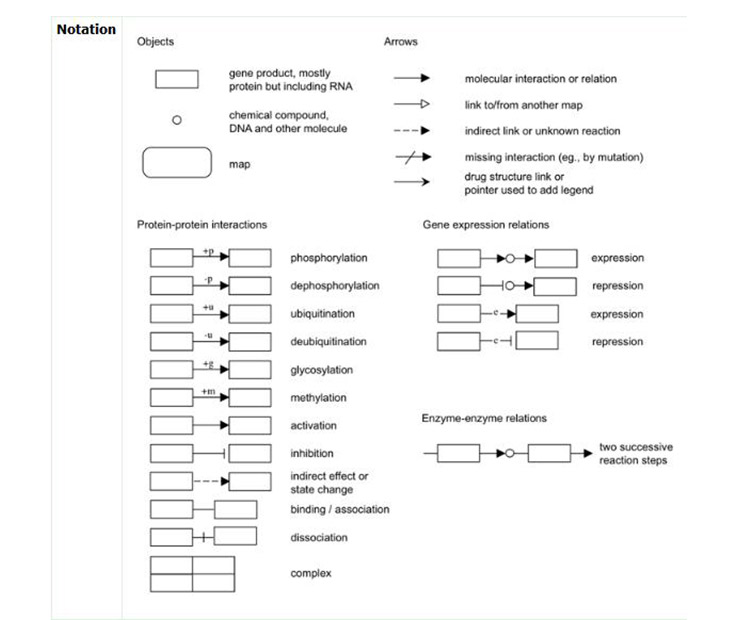
Figure 10 Detailed description of the various markers in KEGG pathway database
6. In the pathway image, each rectangular box represents a specific gene in the pathway. Click the box to enter a new page with a detailed description of the gene. For example, the gene MDM2 can be clicked in to view the related information of this gene (Figure 11).
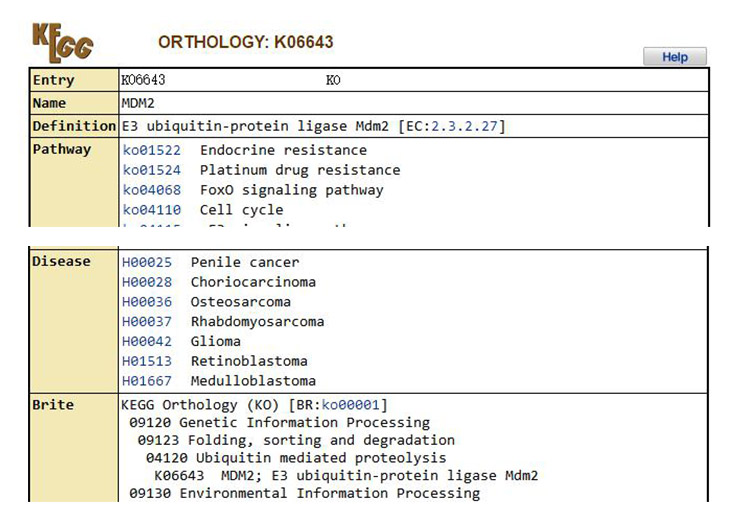
Figure 11 Details of the MDM2 gene
In the global image of pathway, you can also understand several different representations of pathway:
One representation is map and the other is KO. The switch between the two is shown in Figure 12. Click on the drop-down list and select reference pathway (KO) to switch to KO pattern.
The map pathway is the most original, independent and complete representation of each signal pathway, with white background, black font and no other color filling.
When you enter the KO form, you will find that the same pathway is filled with a light blue color in the box. You can also click the specific box to query gene information.
At the same time, you can also select the specific research species in the drop-down bar. At this time, the box fill color becomes light green. This is the more common way we use it.
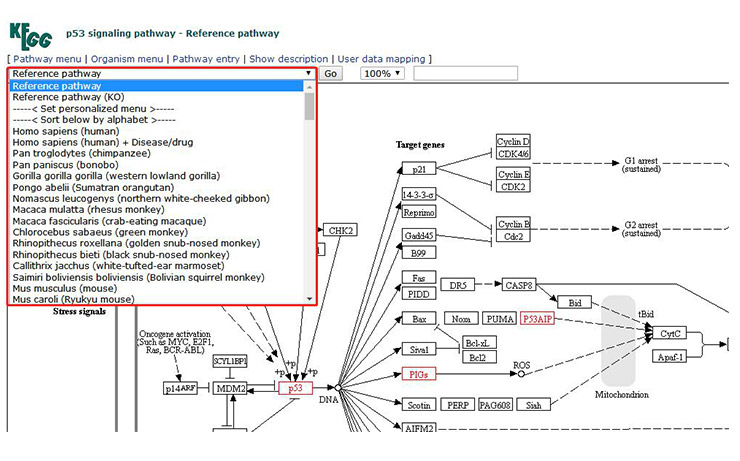
Figure 12 How to transform the representation of the pathway image
Now that we know how to search for signaling pathways in KEGG, how can we use this information for research?
A signaling pathway is a big network, and in that big network, what molecules should we choose to study? In general, once we know the full picture of the signaling pathway, we should choose a path (or several) of interest to detect molecules at key nodes.
For example, we can use a stimulus (such as drugs) to treat cells or experimental animals, and detect molecules, core nodes, downstream molecules, and effector molecules in the upstream of the core node. In this way, the role of this signal path can be effectively explained.
For a gene, if you know experimentally whether it's up-regulated or down-regulated, how do you mark it in the signal pathway?
By clicking “User data mapping” (Figure 13-1) in the upper right corner of the Signal pathway image, a new page appears (as shown in Figure 13-2), and enter the ID number of the gene (each gene has a corresponding ID in the KEGG database) and color on the new page.
For example, let's assume that the gene p21 is up-regulated and Bax is down-regulated. We use red to indicate down-regulation and green to indicate up-regulation. Then we should input the following (as shown in Figure 13-2):
K06625 green
K02159 red
Click pathway mapping and the two genes will show different colors in pathway (as show in Figure 14).
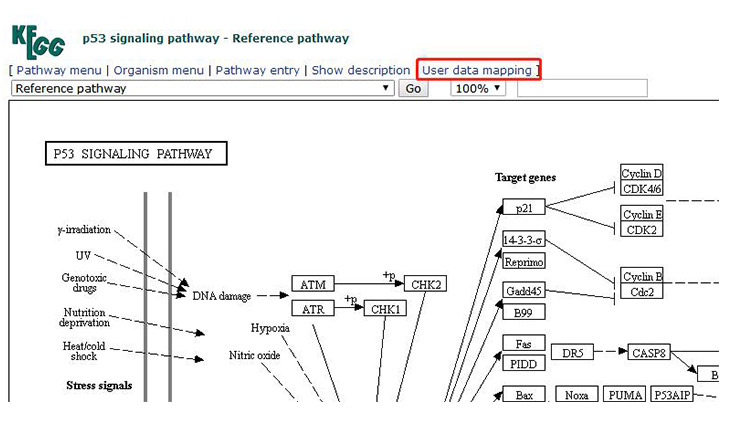
Figure 13-1 Location of user data mapping
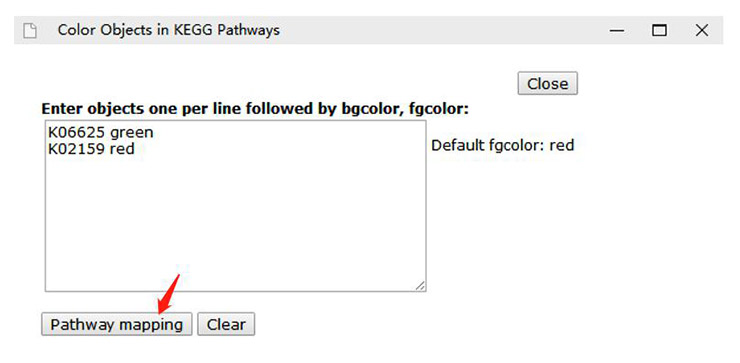
Figure 13-2 Format of information input
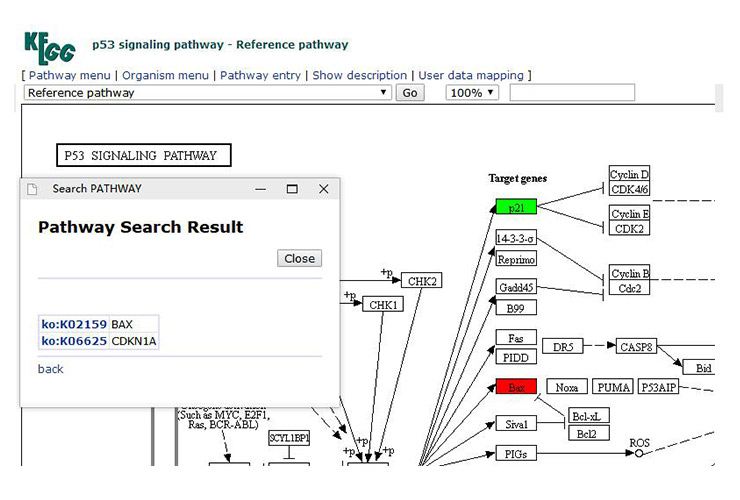
Figure 14
For one or more genes, if we want to identify the signaling pathways in which it participates, we can read the literature about its function and the signaling pathways in which it is involved. Using the KEGG database query is a more convenient way. In the KEGG database, there is also a very useful feature for signal path research: KEGG Mapper.
When you want to link the differentially expressed genes to the signaling pathways you want to study, this KEGG Mapper can help you solve the problem. For example, if you want to know whether one or more genes are involved in a particular pathway. You can follow these steps:
The first is the conversion of gene names. Because the KEGG database only recognizes KEGG, NCBI, and uniprot as primary ID forms, you need to convert your gene into one of these three forms. A convenient way to batch convert is to use Uniprot's online tool.
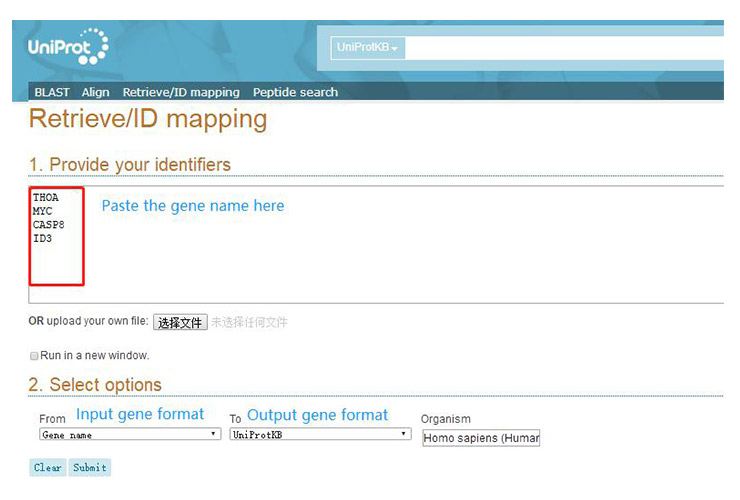
Open the uniprot (https://www.uniprot.org/) website and click “Retrieve/ID mapping”.
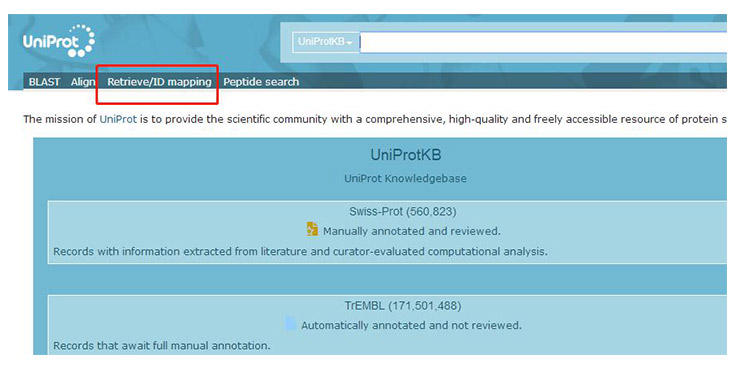
On the page that appears (as shown below), enter the gene name, select the input and output gene formats, and click “submit”.
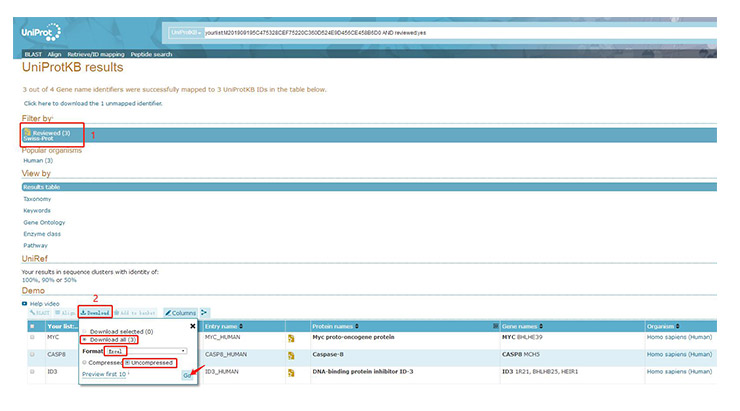
In the popup page, select the Reviewed results and then select the download format (Excel, uncompressed). Entry is the Uniprot code.
Then open the KEGG Mapper (the location of the KEGG Mapper is at the bottom of the home page, as shown in position 2 of Figure 2), click “Search &Color Pathway (and Brite, Module)” in the page, a new page appears, as shown in the Figure 15.
Enter the geneID and the color of the gene you wish to display as shown in the figure, and select the species and the ID type of the data. Then click “Exec” to start the analysis, and then you can see which pathways the gene is involved in (Figure 16). This will save you a lot of time for screening and verification.
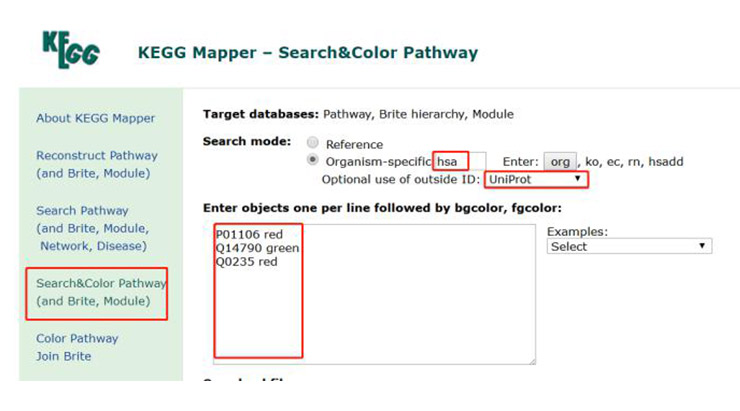
Figure 15
The result is a long list of many signaling pathways, and the number in parentheses after the pathway name is the number of genes in the pathway that we are looking for.
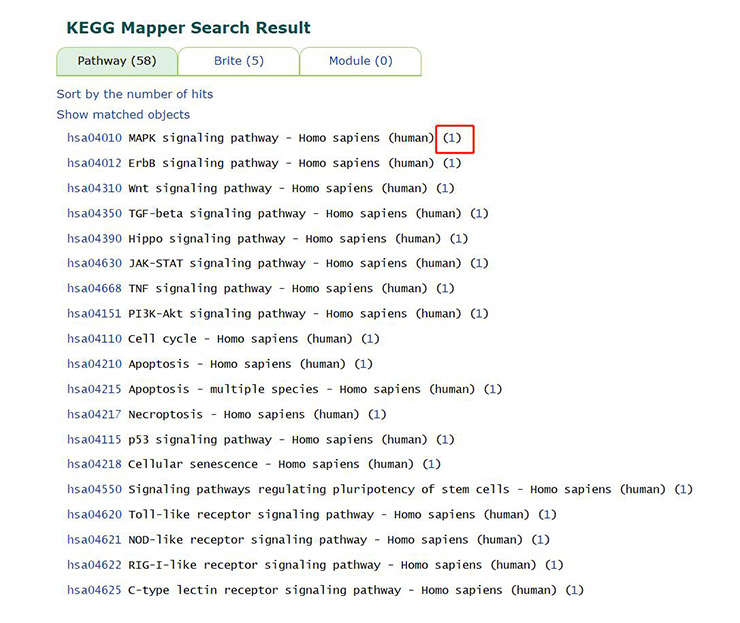
Figure 16
Links:
NCBI website: https://www.ncbi.nlm.nih.gov/
References
[1] Kanehisa M, Goto S, Kawashima S, et al. KEGG: kyoto encyclopaedia of genes and genomes [J]. Nucleic Acids Research, 2000, volume 28(1): 27-30(4).


Comments
Leave a Comment