Call us
301-363-4651 (Available 9 a.m. to 5 p.m. CST from Monday to Friday)
| Code | CSB-E13254Fh |
| Size | 96T,5×96T,10×96T |
| Price | Request a Quote |
| Trial Size |
24T ELISA Kit Trial Size (Only USD$150/ kit) * Sample kit cost can be deducted as a $30 credit for each 96-assay kit of the same analyte and brand you subsequently purchase within six months until depleted. More details >> Interested in a trial size? Please leave a message below.
|
| Have Questions? | Leave a Message or Start an on-line Chat |
| Intra-assay Precision (Precision within an assay): CV%<15% | ||||||
| Three samples of known concentration were tested twenty times on one plate to assess. | ||||||
| Inter-assay Precision (Precision between assays): CV%<15% | ||||||
| Three samples of known concentration were tested in twenty assays to assess. | ||||||
| To assess the linearity of the assay, samples were spiked with high concentrations of fish TNF-α in various matrices and diluted with the Sample Diluent to produce samples with values within the dynamic range of the assay. | ||||||
| Sample | Serum(n=4) | |||||
| 1:1 | Average % | 95 | ||||
| Range % | 89-100 | |||||
| 1:2 | Average % | 93 | ||||
| Range % | 87-99 | |||||
| 1:4 | Average % | 95 | ||||
| Range % | 88-103 | |||||
| 1:8 | Average % | 96 | ||||
| Range % | 90-102 | |||||
| The recovery of fish TNF-α spiked to levels throughout the range of the assay in various matrices was evaluated. Samples were diluted prior to assay as directed in the Sample Preparation section. | ||||||
| Sample Type | Average % Recovery | Range | ||||
| Serum (n=5) | 99 | 95-102 | ||||
| EDTA plasma (n=4) | 95 | 91-101 | ||||
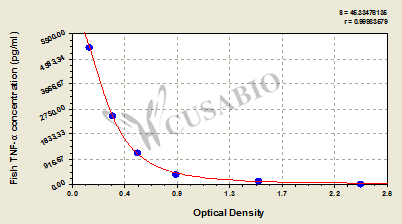
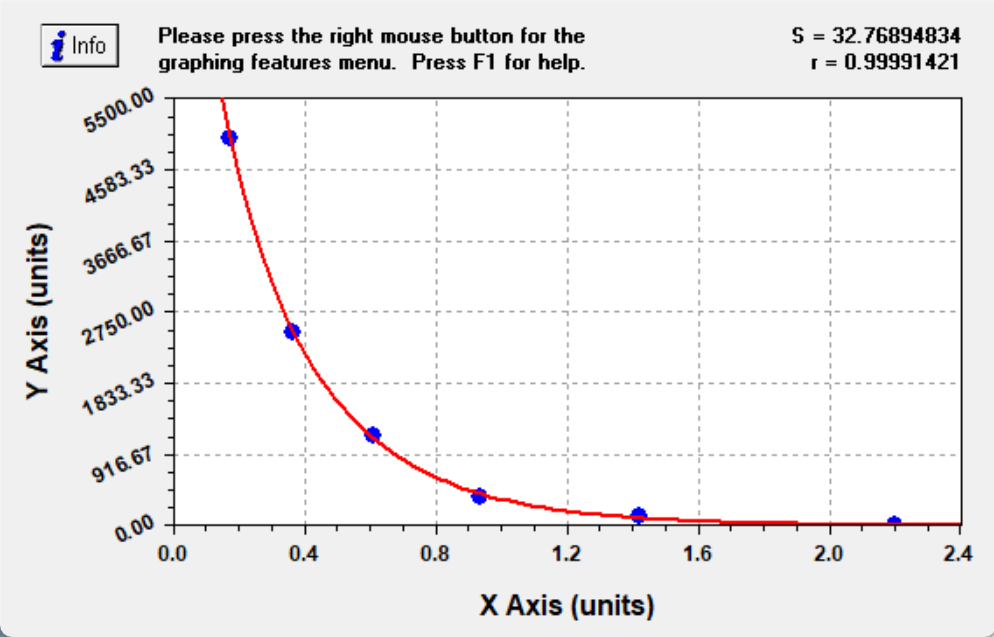
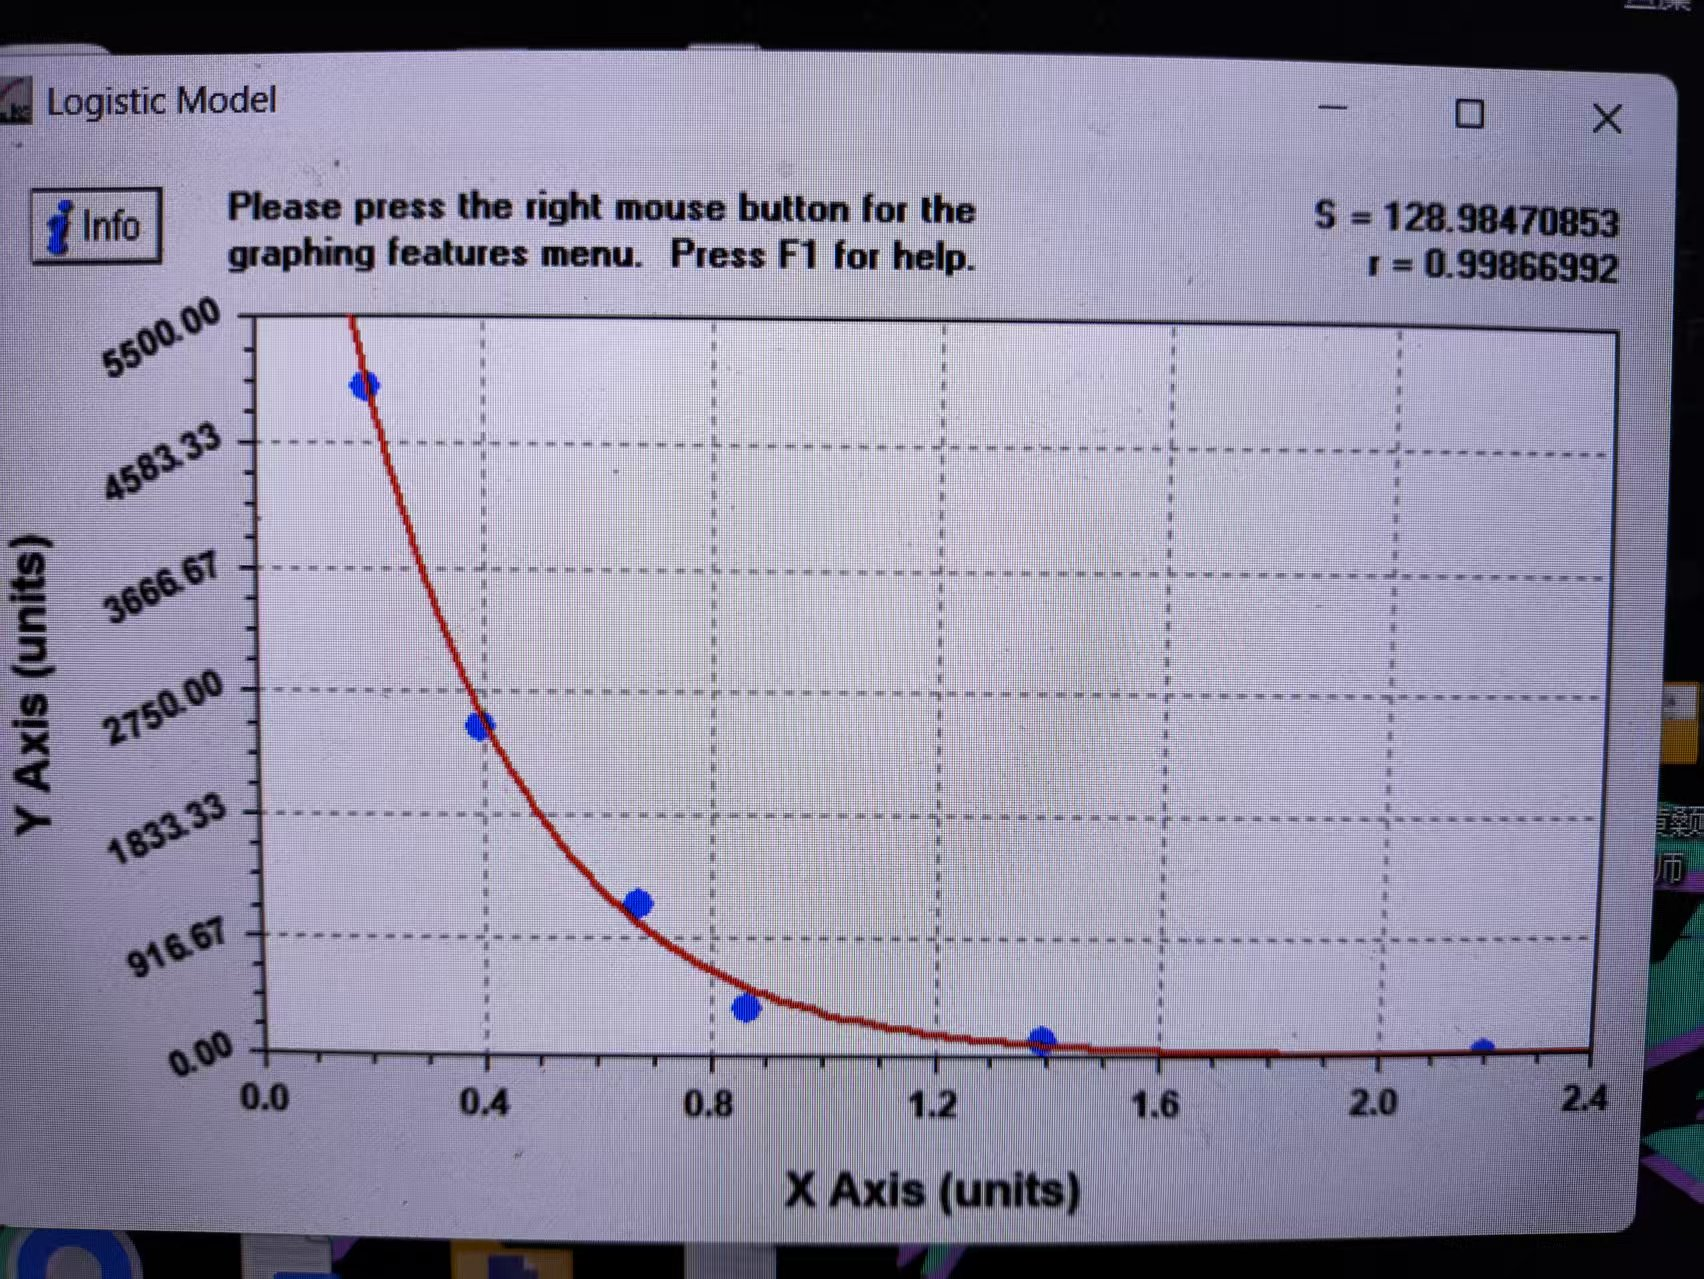
| These standard curves are provided for demonstration only. A standard curve should be generated for each set of samples assayed. | |||||||||||||||||||||||||||||||||||||||||||||||||
|
|||||||||||||||||||||||||||||||||||||||||||||||||
This Fish TNF-α ELISA Kit was designed for the quantitative measurement of Fish TNF-α protein in serum, plasma, tissue homogenates. It is a Competitive ELISA kit, its detection range is 125 pg/mL-5000 pg/mL and the sensitivity is 125 pg/mL.
Sample type: Serum Tissue homogenate Liver
Sample species: Fish
Sample dilution: 1:50
Review: I used CSB-E13254Fh to detect serum and liver homogenate from the normal group. The standard OD values are 2.157, 1.402, 0.928, 0.612, 0.372, 0.186, and the sample OD values are between 0.2 and 1.0.
By Anonymous
Sample type: Serum
Sample species: Fish
Sample dilution: No dilution
Review: I used CSB-E13254Fh to detect the normal group and inflammation group of Micropterus salmoides. The OD values of the standard curve were 2.217/1.409/0.881/0.692/0.414/0.214, and the r value of the standard curve was greater than 0.99, which was relatively accurate.
By Anonymous