Call us
301-363-4651 (Available 9 a.m. to 5 p.m. CST from Monday to Friday)
Since its development in 1979 by Towbin and colleagues, Western blotting (WB) has become an indispensable tool for detecting specific proteins in a complex sample [1]. Its enduring value lies in its ability to provide information not just on the presence or absence of a target protein, but also on its relative abundance, post-translational modifications (e.g., phosphorylation, glycosylation), and approximate molecular weight.
While high-throughput proteomic technologies emerge, Western blotting remains the "gold standard" for protein validation due to its specificity, sensitivity, and accessibility. However, the path to obtaining publication-quality blots is often fraught with challenges.
This guide aims to be a comprehensive manual, demystifying the principles, providing a step-by-step protocol, and offering evidence-based solutions to common problems, empowering you to move from frustration to proficiency.
Table of Contents
2. The Core Principle of Western Blot
3. Western Blot in Action: Key Applications in Biomedical Research
4. Western Blot Troubleshooting
Western blot, also called protein immunoblotting, is a widely used laboratory technique in molecular biology and biochemistry to qualitatively or semi-quantitatively detect a specific protein in a biological sample and estimate its molecular weight [2][4].
Western blotting involves separating proteins by polyacrylamide gel electrophoresis (PAGE) according to their molecular size, transferring and immobilizing them onto a nitrocellulose or Polyvinylidene Difluoride (PVDF) membrane, and then selectively detecting target proteins using a specific antibody-mediated detection system.
Western blotting is a multi-step process that separates proteins by size and then uses antibody-antigen interactions to identify a specific protein. The entire workflow can be visualized in seven key stages:
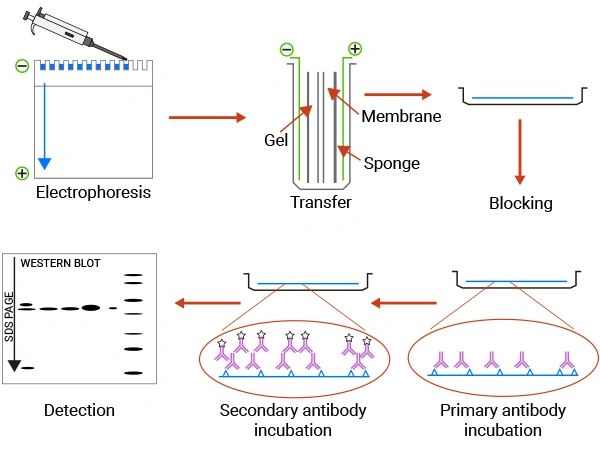
Figure 1. The brief workflow of WB
① Sample Separation: The first step is to extract proteins from cells or tissues while preserving their state.
• Lysis Buffer Selection: Cells or tissues are lysed using a suitable lysis buffer containing detergents to solubilize proteins and release cellular contents. The choice of lysis buffer is critical and depends on the protein's localization and properties. RIPA buffer is effective for total cellular protein extraction, but can be too harsh for some protein complexes. Mild detergents like NP-40 are better for preserving protein-protein interactions.
Table 1. Protein location and lysis buffer choice
| Protein Location | Buffer Recommended |
|---|---|
| Whole Cell | NP-40 |
| Cytoplasmic (soluble) | Tris-HCI |
| Cytoplasmic (cytoskeletal-bound) | Tris-Triton |
| Membrane bound | NP-40/ RIPA |
| Nuclear | RIPA or use the nuclear fraction protocol |
| Mitochondria | RIPA or use the mitochondrial fraction protocol |
• Inhibitors: Protease and phosphatase inhibitors must be added fresh to the lysis buffer to prevent protein degradation and maintain post-translational modification states [3].
Table 2. Commonly used protease inhibitors
| Protease inhibitor | Function | Working concentration | Characters |
|---|---|---|---|
| PMSF | Serine proteases inhibitor Cysteine proteases inhibitor |
0.5-1 mM | PMSF has a short half-life in water and needs to be added shortly before use. Very toxic, should pay attention to self-protection during experimental operation |
| APMSF | Serine proteases inhibitor | 0.4-4 mM | - |
| Pepstatin | Aspartyl proteases inhibitor | 1 μM | Store at -4℃ for 1 week, -20℃ for up to 1 month; avoid repeated freeze/thaw cycle. |
| Leupeptin | Serine proteases inhibitor and Cysteine proteases inhibitor | 10-100 μM | Store at -4℃ for 1 week, -20℃ for up to 1 month; avoid repeated freeze/thaw cycle. |
| Aprotinin | Serine proteases inhibitor | 0.01-0.03 μM | Store at -4℃ for 1 week, -20℃ for up to 1 month; avoid repeated freeze/thaw cycle. |
| Na3VO4 | Phosphatases inhibitor | 1 mM | Need to be activated. Add acid to adjust the pH to 10 after dissolving, and heat to boil to colorless, cool at room temperature, then adjust the pH to 10 again. Repeat the steps until the solution remains colorless and the pH is stable at 10, aliquot and store at -20 ° C. |
| NaF | Phosphatases inhibitor | 10-20 mM | - |
• Quantification and Denaturation: Accurate protein quantification using the BCA or Bradford assay is essential for equal loading. Subsequent denaturation in a loading buffer (e.g., Laemmli buffer containing SDS and β-mercaptoethanol) ensures proteins are linearized and uniformly charged (based on molecular weight).
② Gel Electrophoresis
Denatured proteins are separated based on their molecular weight using Sodium Dodecyl Sulfate-Polyacrylamide Gel Electrophoresis (SDS-PAGE).
• Gel Preparation: SDS-PAGE uses a discontinuous gel system with a stacking gel (upper, low concentration) and a separating gel (lower, higher concentration).
Proteins gradually separate into distinct bands based on their molecular weight, conformation, and net charge.
Gel concentration determines pore size, which directly impacts electrophoretic separation (the sieving effect). The percentage of the separating gel is chosen based on the molecular weight of the target protein to achieve optimal resolution.
Table 3. Gel percentage and corresponding protein size
| Gel acrylamide (%) | Protein size (kDa) |
|---|---|
| 8 | 25-200 |
| 10 | 15-100 |
| 12.5 | 10-70 |
| 15 | 12-45 |
| 20 | 4-40 |
• Loading and Running: A molecular weight marker, comprising prelabeled proteins of known molecular weights, is loaded on the gel with the denatured protein samples to serve as a size reference. The optimal total protein load must be determined empirically (a good starting point is 20-50 µg per lane for whole-cell lysates). Overloading can cause distorted bands, while underloading results in weak signals. The gel unit is filled with running buffer (e.g., Tris-Glycine with SDS).
The essential controls in WB:
| Control Type | Primary Function | Key Characteristics & Common Examples | Critical Role in Experiment Validation |
|---|---|---|---|
| Loading Control | To correct for variations in total protein loading across lanes, ensuring accurate comparison of target protein levels between different samples. | Proteins that are constitutively and stably expressed across the samples being compared. Examples: β-Actin, GAPDH, α-Tubulin, and total protein staining. | Validates that observed differences in the target protein's signal are due to biological changes, not technical errors in sample preparation or loading. |
| Positive Control | To confirm that the entire Western blot system (antibodies, buffers, detection reagents) is functioning correctly and can detect the target protein. | A sample known to express the target protein. Examples: Cell lysates from a characterized cell line, tissues, or recombinant control proteins (e.g., Phosphorylated Bad Protein , active Erk2 protein). | Acts as a procedural proof. A clear signal from the positive control verifies the experiment's integrity; its absence indicates a technical problem. |
| Negative Control | To confirm the specificity of the primary antibody by demonstrating the absence of signal when the target protein is not present. | A sample known not to express the target protein. Examples: Untransfected cells (if the target is from a transfection), gene knockout cell lysates, unstimulated cells (for inducible proteins like phospho-proteins). | Ensures that the detected signal is specific to the target antigen and not due to non-specific antibody binding or background noise. |
Frequently used loading control:
| Loading control | Sample Type | Molecular Weight (kDa) | Precautions |
|---|---|---|---|
| β-Actin |
Whole cell/Cytoplasm | 42 | Not valid for skeletal muscle samples. Changes in growth conditions and interactions with extracellular matrix components can alter actin synthesis. |
| GAPDH | Whole cell/Cytoplasm | 30-40 | Some physiological factors, such as hypoxia or diabetes, increase GAPDH expression in certain cell types. |
| Tubulin | Whole cell/Cytoplasm | 55 | Tubulin expression may vary with resistance to antimicrobial and antimitotic agents. |
| COXIV | Mitochondria | 16 | Many proteins migrate at the same molecular weight (16 kDa) as COXIV. |
| Lamin B1 | Nucleus | 66 | Not valid for samples where the nuclear membrane has been removed. |
| TATA-binding protein (TBP) | Nucleus | 38 | Not valid for samples without DNA. |
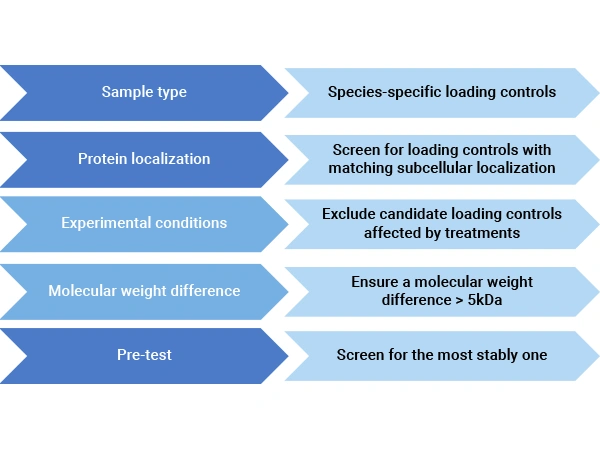
Figure 2. Considerations in Choosing Loading Controls
An electric current is applied, typically starting at 80V to allow the samples to stack through the stacking gel, then increased to 100-120V for separation through the resolving gel. The process continues until the dye front reaches the bottom of the gel.
③ Transfer: The separated proteins are transferred from the gel onto a stable solid support, typically a nitrocellulose or Polyvinylidene Difluoride (PVDF) membrane, where they are immobilized for probing with antibodies.
• Membrane Preparation: Nitrocellulose membrane (0.45 μm) is suitable for most proteins, while PVDF membrane is more suitable for small molecular weight or hydrophobic proteins. PVDF membranes must be activated by soaking in isopropanol for a few minutes before equilibration in cold transfer buffer.
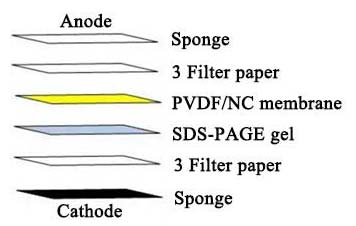
• Assembling the "Sandwich": The transfer stack is assembled in a cassette submerged in transfer buffer. To assemble the "sandwich," the order is as follows (from cathode to anode): sponge, filter papers, the gel, the membrane, filter papers, sponge.
Tip: Ensure there are no air bubbles between the gel and PVDF membrane, and squeeze out extra liquid. Use a roller meticulously to remove all bubbles after assembling the "transfer sandwich."
• Electrophoretic Transfer: The cassette is placed in a tank filled with cold transfer buffer (e.g., Tris-Glycine with 20% methanol). After assembly is complete, set the transfer current for each gel to 60 mA and run at constant current for 40 to 60 minutes.
The negatively charged proteins migrate out of the gel and bind to the membrane. After transfer, stain the membrane with Ponceau S or the gel with Coomassie Blue to confirm complete protein removal from the gel and even transfer.
④ Blocking: The membrane is blocked to prevent antibodies from binding nonspecifically to the membrane surface, which would cause a high background.
Prepare a blocking solution by mixing PBS buffer with 5% non-fat dry milk. Rinse the transferred membrane with PBS, then add 10-15 mL of blocking solution and incubate at 25°C with shaking for 40-60 minutes.
Tip: Non-fat dry milk is cost-effective but contains biotin and phosphoproteins, making it unsuitable for detecting biotinylated or phosphorylated proteins. For phospho-specific antibodies, 3-5% BSA is the gold standard.
⑤ Primary Antibody Incubation: Discard the blocking solution and add the pre-prepared antibody dilution with non-fat dry milk. Add 10 mL of dilution to each membrane, and incubate overnight at 4°C with shaking in an incubator.
Primary Antibody: A highly specific antibody that binds to the target protein (antigen).
After primary antibody incubation, the membrane is washed several times (typically 3-4 times for 8-10 minutes per wash) with PBST to remove unbound primary antibody.
⑥ Secondary Antibody Incubation: Place the membrane in an incubation box and add the secondary antibody dilution prepared with non-fat dry milk, and incubate at 25°C in a shaking incubator for 1 hour.
After incubation, the membrane is washed thoroughly (3-4 times for 8-10 minutes per wash) with PBST to remove any unbound secondary antibody, which is crucial for reducing background noise.
Secondary Antibody: An antibody that recognizes and binds to the primary antibody. This secondary antibody is conjugated to a reporter enzyme, most commonly Horseradish Peroxidase (HRP).
Tip: The optimal dilution for primary and secondary antibodies must be determined by titration. Follow the manufacturer's recommendation as a starting point.
⑦ Detection: A substrate for the conjugated enzyme is added. In the case of HRP, a chemiluminescent substrate produces light when oxidized by HRP. This light signal, which corresponds to the location and amount of the target protein, is captured by X-ray film or a digital chemiluminescence imaging system.
• The membrane is briefly drained and then exposed to an X-ray film or imaged using a digital chemiluminescence imaging system. The exposure time is optimized—from a few seconds to several minutes—depending on the signal strength. A strong signal may require only a 30-second exposure, while a weak signal might need a 30-minute or even overnight exposure.
• After development, the film or digital image is analyzed. The molecular weight of the target protein is confirmed by comparing its position to the protein ladder. The intensity of the band can be used for semi-quantitative analysis.
Signal Saturation: The most frequent error in quantification. If the signal is too strong, it will saturate the detector, losing linearity. Always capture multiple exposures with different durations.
Substrate Application: Apply the ECL substrate mixture evenly across the membrane. Ensure no pools of liquid remain, as this can create uneven signals. If you are struggling with your WB experiment, here is a detailed WB protocol that might help.
Western blotting is a powerful and versatile technique widely used in molecular biology and biochemistry to detect specific proteins in a sample. Its high specificity, achieved through antibody-antigen recognition, makes it invaluable for research purposes.
This is the most fundamental application: confirming the presence or absence of a specific protein.
This application assesses the relative change in a target protein's abundance or modification state in response to a stimulus.
This compares the basal expression levels of a protein across different biological sources.
Western blotting is powerful for analyzing post-translational modifications (PTMs).
In biotechnology, Western blotting is a key quality control (QC) step.
Despite its seemingly straightforward procedure, Western blotting is prone to a variety of issues that can lead to unexpected outcomes. These problems are generally grouped into the following categories: no visible bands or weak signal, high background on the blot, unexpected bands, and uneven spots on the blot.
This table addresses the most common Western blot issues [2].
| Problem | Potential Cause(s) | Solutions |
|---|---|---|
| No Visible Bands /Weak Signals | Protein Transfer Failure | Adjust the transfer buffer composition, pH, and transfer time |
| The primary antibody may have lost its activity or low concentration | Replace with a new one or increase the antibody concentration | |
| Use the wrong secondary antibody | Use a secondary antibody that is specific to the species in which the primary antibody is produced. | |
| ECL reagent is out of date | Use fresh substrate | |
| Insufficient protein loading | Increase the amount of protein loaded | |
| High Background | Insufficient Blocking | Increase blocking time and optimize the blocking agent |
| Non-specific binding induced by high antibody concentration | Titrate the antibody to determine the optimal concentration | |
| Insufficient washing | Increase washing time and wash cycles; increase the Tween 20 concentration in the wash buffer | |
| Membrane contamination | Always wear clean gloves and use forceps when handling membranes | |
| Unexpected Bands | Poor Antibody Specificity | Choose Highly Specific Antibodies |
| The primary antibody may bind non-specifically to endogenous proteins | Run a negative control to confirm what the primary antibody is binding to | |
| Protein degradation/modification | Add protease inhibitors; use a positive control to identify the cause | |
| Primary concentration is high | Optimize antibody concentration to minimize nonspecific binding while maximizing signal intensity | |
| Uneven Bands | Incomplete reduction caused abnormal bands or tailing | Use fresh reducing agents, and boil the sample for 5-10 minutes |
| Excessive voltage or overheating causes "Smiling" bands | Reduce the voltage, run the gel in a 4°C cold room, or on ice | |
| High enzyme concentration causes rapid depletion of substrates → Loss of luminescence antibodies | Reduce the amount of protein, lower the concentration of primary and secondary |
Scientific Publication Requirements [5] :
If cut, ensure at least one marker above and below the target protein
Vendor, Catalog #, species, dilution
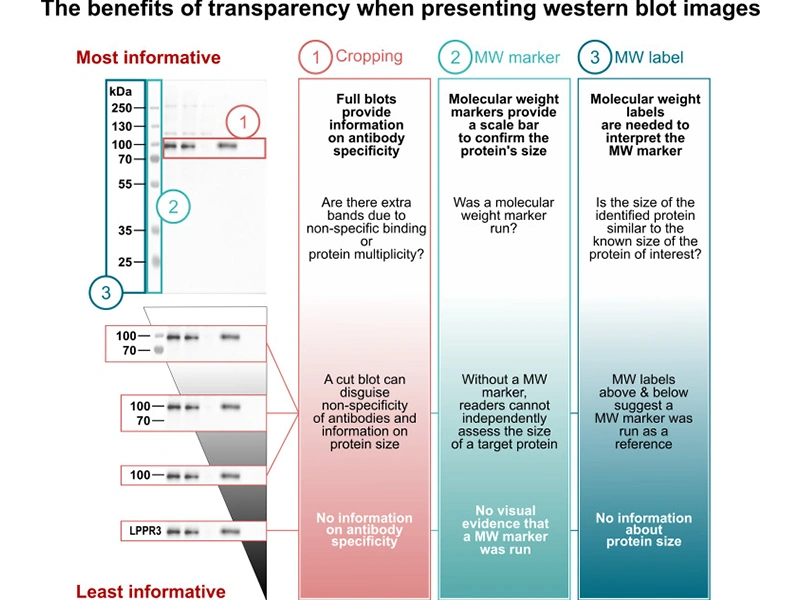
Figure 3. The benefits of transparency when presenting Western blot images [9]
A Western blot is not quantitative without proper controls and analysis.
a. Convert Image: Use a linear, non-saturated image format (16-bit TIFF).
b. Define Lanes and Bands: Draw rectangles around bands and the local background.
c. Measure and Normalize: Calculate integrated density for the target and loading control band. Normalize (Target/Loading Control).
d. Background Subtraction: Subtract the background intensity from the band intensity.
e. Normalization: Divide the background-corrected intensity of the target protein by the intensity of the loading control in the same lane. This gives the normalized target protein level.
Western blotting is a fundamental technique for qualitative analysis and providing molecular weight information. Despite its standardized procedure, the technique requires meticulous execution to avoid common issues like high background, weak or absent signals, and non-specific bands, which often stem from problems in sample preparation, antibody specificity, or detection steps.
Recommended Resources:
References
[1] Towbin, H., Staehelin, T., & Gordon, J. (1979). Electrophoretic transfer of proteins from polyacrylamide gels to nitrocellulose sheets: procedure and some applications [J]. Proceedings of the National Academy of Sciences, 76(9), 4350–4354.
[2] Mahmood T, Yang PC. Western blot: technique, theory, and trouble shooting [J]. N Am J Med Sci. 2012 Sep;4(9):429-34.
[3] Ghosh R, Gilda JE, Gomes AV. The necessity of and strategies for improving confidence in the accuracy of Western blots [J]. Expert Rev Proteomics. 2014 Oct;11(5):549-60.
[4] Kurien, B. T., & Scofield, R. H. (2015). Western blotting: an introduction [J]. Methods in Molecular Biology, 1312, 17–30.
[5] Tie, L., Xiao, H., Wu, Dl. et al. A brief guide to good practices in pharmacological experiments: Western blotting [J]. Acta Pharmacol Sin 42, 1015–1017 (2021).
[6] Uhlen, M., et al. (2016). A proposal for validation of antibodies [J]. Nature Methods, 13(10), 823–827.
[7] Slamon, D. J., et al. (2001). Use of chemotherapy plus a monoclonal antibody against HER2 for metastatic breast cancer that overexpresses HER2 [J]. New England Journal of Medicine, 344(11), 783-792.
[8] Ferguson, R. E., et al. (2005). Housekeeping proteins: a preliminary study illustrating some limitations as useful references in protein expression studies [J]. Proteomics, 5(2), 566–571.
[9] Kroon, C., Breuer, et al. (2022). Blind spots on western blots: Assessment of common problems in western blot figures and methods reporting with recommendations to improve them [J]. PLoS Biology, 20(9), e3001783.


Comments
Leave a Comment