Call us
301-363-4651 (Available 9 a.m. to 5 p.m. CST from Monday to Friday)
| Code | CSB-E06903Rb |
| Size | 96T,5×96T,10×96T |
| Price | Request a Quote |
| Trial Size |
24T ELISA Kit Trial Size (Only USD$150/ kit) * Sample kit cost can be deducted as a $30 credit for each 96-assay kit of the same analyte and brand you subsequently purchase within six months until depleted. More details >> Interested in a trial size? Please leave a message below.
|
| Have Questions? | Leave a Message or Start an on-line Chat |
| Intra-assay Precision (Precision within an assay): CV%<8% | ||||||
| Three samples of known concentration were tested twenty times on one plate to assess. | ||||||
| Inter-assay Precision (Precision between assays): CV%<10% | ||||||
| Three samples of known concentration were tested in twenty assays to assess. | ||||||
| To assess the linearity of the assay, samples were spiked with high concentrations of rabbit IL-6 in various matrices and diluted with the Sample Diluent to produce samples with values within the dynamic range of the assay. | ||||||
| Sample | Serum(n=4) | |||||
| 1:1 | Average % | 88 | ||||
| Range % | 80-92 | |||||
| 1:2 | Average % | 99 | ||||
| Range % | 91-105 | |||||
| 1:4 | Average % | 101 | ||||
| Range % | 92-110 | |||||
| 1:8 | Average % | 93 | ||||
| Range % | 86-98 | |||||
| The recovery of rabbit IL-6 spiked to levels throughout the range of the assay in various matrices was evaluated. Samples were diluted prior to assay as directed in the Sample Preparation section. | ||||||
| Sample Type | Average % Recovery | Range | ||||
| Serum (n=5) | 93 | 89-98 | ||||
| EDTA plasma (n=4) | 96 | 90-100 | ||||
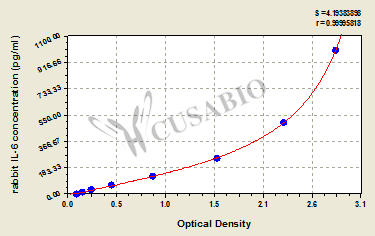
| These standard curves are provided for demonstration only. A standard curve should be generated for each set of samples assayed. | |||||||||||||||||||||||||||||||||||||||||||||||||||||||||||||||
| |||||||||||||||||||||||||||||||||||||||||||||||||||||||||||||||
This Rabbit IL6 ELISA Kit was designed for the quantitative measurement of Rabbit IL6 protein in serum, plasma, tissue homogenates. It is a Sandwich ELISA kit, its detection range is 15.6 pg/mL-1000 pg/mL and the sensitivity is 3.9 pg/mL.
Sample type: Tissue homogenate(liver)
Sample species: Rabbit
Review: I tried liver and serum samples treated and untreated rabbits, the idea was to see with concentration was the best to perform real experiments. The kit works better using liver samples.
By Anonymous
Sample type: Plasma (anticoagulant)
Sample species: Rabbit
Sample dilution: No dilution
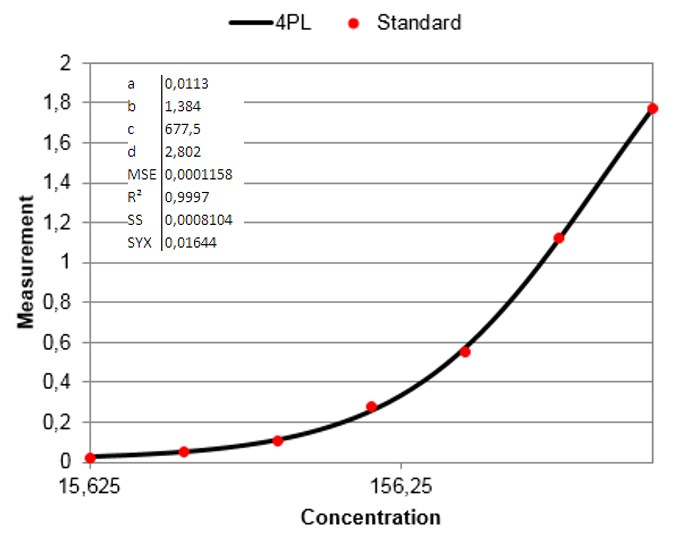
Review: I used CSB-E06903Rb to detect the plasma of the model group before operation, 30min-2 hours during operation, and 24 hours after operation. The R2 of the standard curve fitted by the four-parameter model was 0.99984 (see the picture for details). The standard curve met the expectation and the OD value was in the range of 0 to 2.5, and the data were in line with the expected trend. The test of this kit is stable, and we will continue to buy 96T in the future.
By Anonymous
Sample type: Plasma (anticoagulant)
Sample species: Rabbit
Sample dilution: No dilution
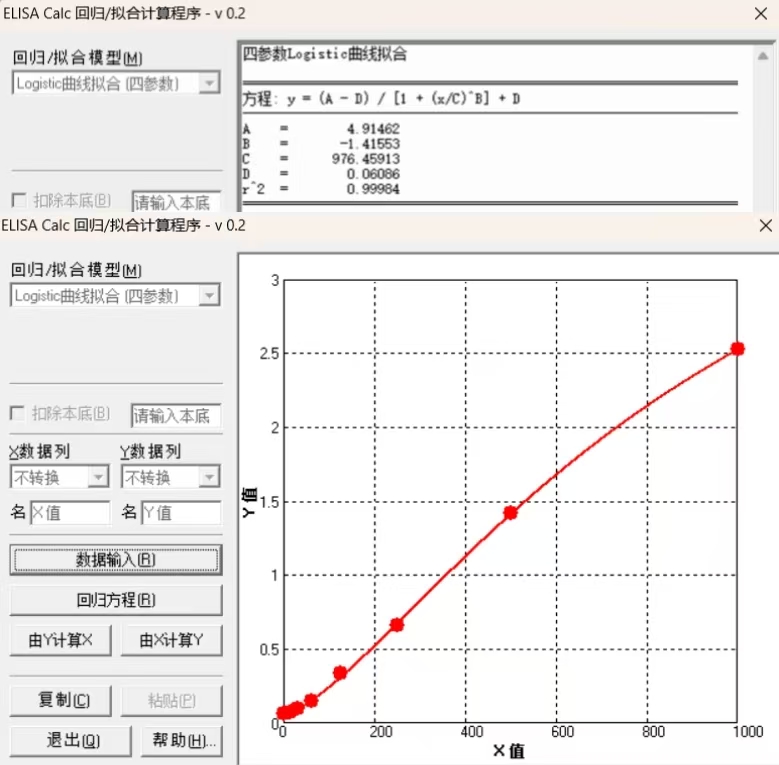
Review: The second time, I used CSB-E06903Rb to detect the plasma of the treatment group before surgery, 30min-2 hours during surgery, and 24 hours after surgery. The R2 of the standard curve fitted by the four-parameter model was 0.99998 (see the picture), the standard curve was in line with the expected and the OD value was in the range of 0 to 3.39, and the data were in line with the expected trend. The kit tested stable and the treatment was effective
By Anonymous
Sample type: Plasma (anticoagulant)
Sample species: Rabbit
Sample dilution: No dilution
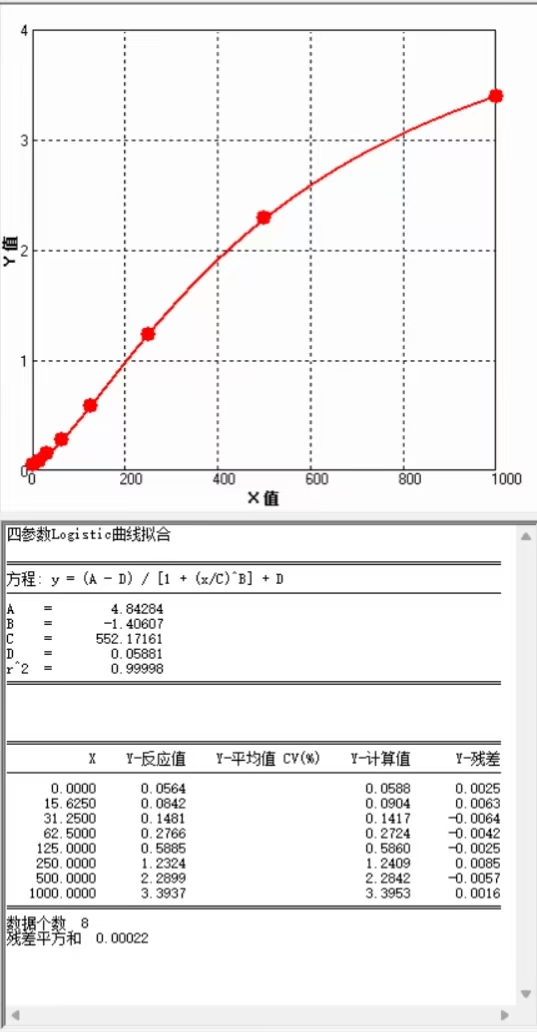
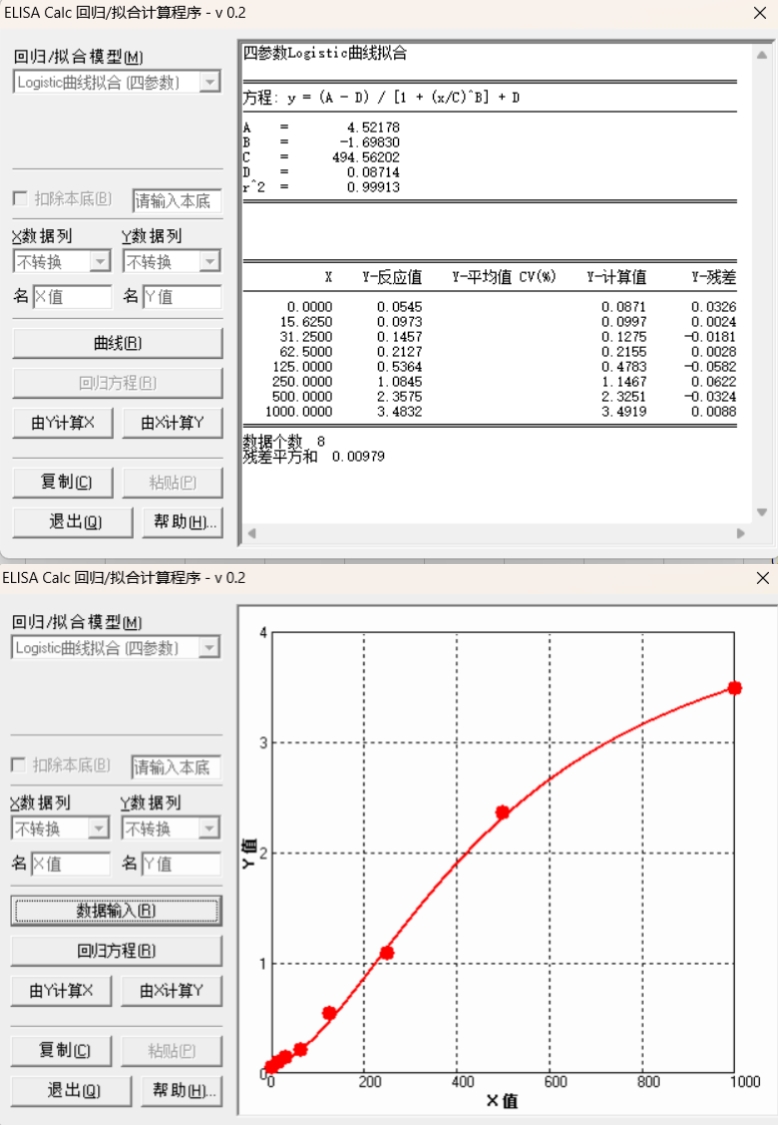
Review: I used CSB-E06903Rb to measure the plasma of the model group before operation, 30min-2 hours during operation, and 24 hours after operation. The R2 of the standard curve fitted by the four-parameter model was 0.99913 (see the picture for details). The standard curve was made in two columns, which met the expectation and the OD value was in the range of 0 to 3.5, and the data were in line with the expected trend. It was 150-170 pg/ml before operation, increased to 400 pg/ml two hours during operation, and decreased to 220 pg/ml 24 hours after operation. There are individual differences in rabbits. The standard curve data are shown in the figure, and the data of rabbit modeling are expressed by FOLD CHANGE, which is prepared for the subsequent paper.
By Anonymous