Call us
301-363-4651 (Available 9 a.m. to 5 p.m. CST from Monday to Friday)
| Code | CSB-E04740h |
| Size | 96T,5×96T,10×96T |
| Price | Request a Quote |
| Trial Size |
24T ELISA Kit Trial Size (Only USD$150/ kit) * Sample kit cost can be deducted as a $30 credit for each 96-assay kit of the same analyte and brand you subsequently purchase within six months until depleted. More details >> Interested in a trial size? Please leave a message below.
|
| Have Questions? | Leave a Message or Start an on-line Chat |
| Intra-assay Precision (Precision within an assay): CV%<8% | ||||||
| Three samples of known concentration were tested twenty times on one plate to assess. | ||||||
| Inter-assay Precision (Precision between assays): CV%<10% | ||||||
| Three samples of known concentration were tested in twenty assays to assess. | ||||||
| To assess the linearity of the assay, samples were spiked with high concentrations of human TNF-α in various matrices and diluted with the Sample Diluent to produce samples with values within the dynamic range of the assay. | ||||||
| Sample | Serum(n=4) | |||||
| 1:1 | Average % | 96 | ||||
| Range % | 89-99 | |||||
| 1:2 | Average % | 90 | ||||
| Range % | 85-95 | |||||
| 1:4 | Average % | 97 | ||||
| Range % | 88-102 | |||||
| 1:8 | Average % | 92 | ||||
| Range % | 85-100 | |||||
| The recovery of human TNF-α spiked to levels throughout the range of the assay in various matrices was evaluated. Samples were diluted prior to assay as directed in the Sample Preparation section. | ||||||
| Sample Type | Average % Recovery | Range | ||||
| Serum (n=5) | 97 | 94-101 | ||||
| EDTA plasma (n=4) | 96 | 88-99 | ||||
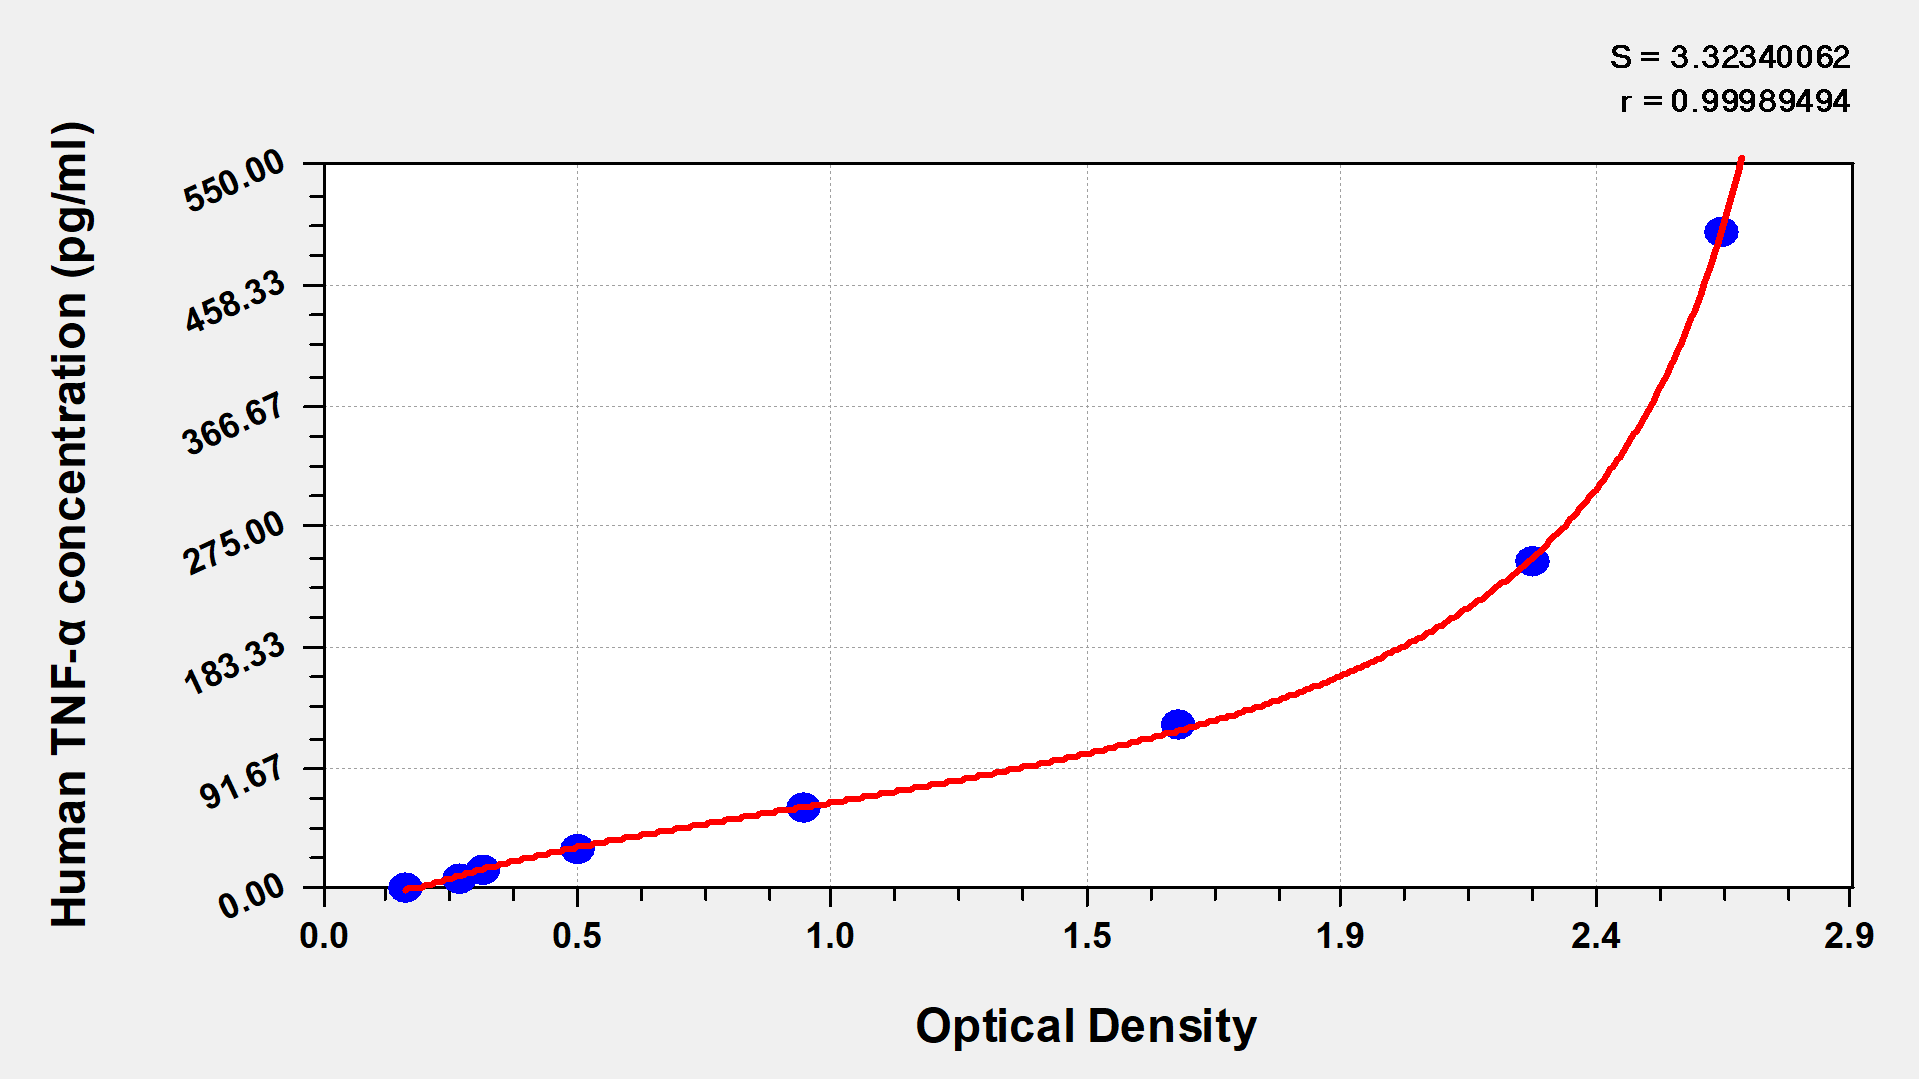
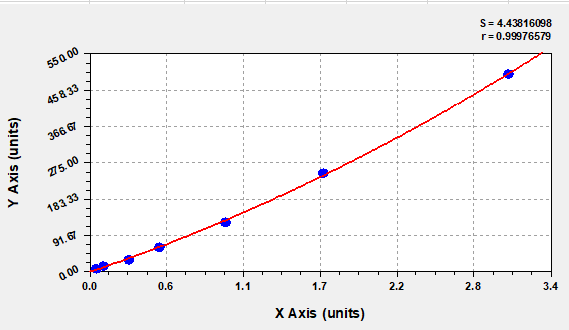
| These standard curves are provided for demonstration only. A standard curve should be generated for each set of samples assayed. | |||||||||||||||||||||||||||||||||||||||||||||||||||||||||||||||
|
|||||||||||||||||||||||||||||||||||||||||||||||||||||||||||||||
Human TNF-α ELISA Kit is designed to quantify human TNF-α levels in the serum, plasma, cell culture supernates, tissue homogenates, or cell lysates. It quantitates human TNF-α with 1.95 pg/mL sensitivity and shows excellent specificity for human TNF-α. This human TNF-α ELISA kit includes both the capture and the detection antibodies for TNF-α as well as avidin conjugated Horseradish Peroxidase (HRP) and TMB substrate solution, which are the reagents used in color development step. The produced color develops in proportion to the amount of TNF-α in the sample. The color development is stopped and the color intensity is measured using a microplate reader.This ELISA kit has been cited in 95 publications.
TNF-α is an inflammatory cytokine generated by macrophages/monocytes during acute inflammation. It contributes to a wide range of signaling events within cells, resulting in necrosis or apoptosis. It also plays an important role in the resistance to infection and malignancies. TNF-α binds to two different receptors TNFR1 and TNFR2, activating a downstream signal cascade, including NF-κB and MAPK pathways, evoking a variety of cellular responses, such as inflammation, host defense, cell survival, differentiation, and proliferation. Dysregulation of TNF-α signaling is related to chronic inflammation and autoimmune diseases. TNF-α inhibitors have been successfully produced and employed in the clinical treatment of autoimmune disorders such as Crohn's disease (CD) and RA due to TNF-α participation in the pathogenesis of autoimmune diseases.
Sample type: Serum
Sample species: Human
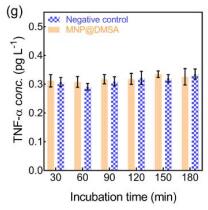
Review: Cell viability and cytotoxicity of PBMCs (e), IL-6 (f) and TNF-α(g) secretion levels with different incubation time. Temperature was 37.5 °C, MNP@DMSA concentration was 1.0 mg/mL, and incubation time was 120 minutes.
By Anonymous
Sample type: Serum
Sample species: Human
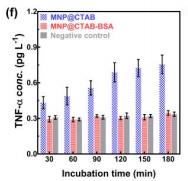
Review: Concentrations of IL-6 and TNF-α in MNP@CTAB-BSA group maintain at normal level when the incubation time increases from 30 minutes to 180 minutes. Concentrations of IL-6 and TNF-α in MNP@CTAB group rise above the normal level with prolonged incubation time.
By Anonymous
Sample type: Cell culture supernatant
Sample species: Human
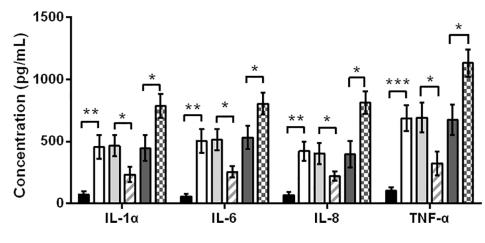
Review: Same trend was observed in the concentrations of IL-1α, IL-6, IL-8 and TNF-α in cell culture supernatant.
By Anonymous
Sample type: Serum
Sample species: Human
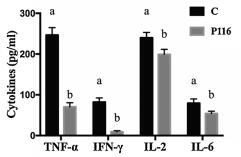
Review: ELISA was used to analyze cytokines (TNF-α, IFN-γ, IL-2 and IL-6) expression after Jurkat and P116 cells were stimulated with anti-CD3/CD28 antibodies for 24 hours.
By Anonymous
Sample type: Cell culture supernatant
Sample species: Human
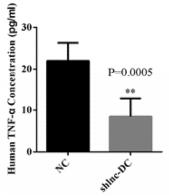
Review: The ELISA data indicate that Lnc-DC silencing significantly decreased the concentration of TNF-α.
By Anonymous
Sample type: Serum
Sample species: Human
Sample dilution: : 1:2.5
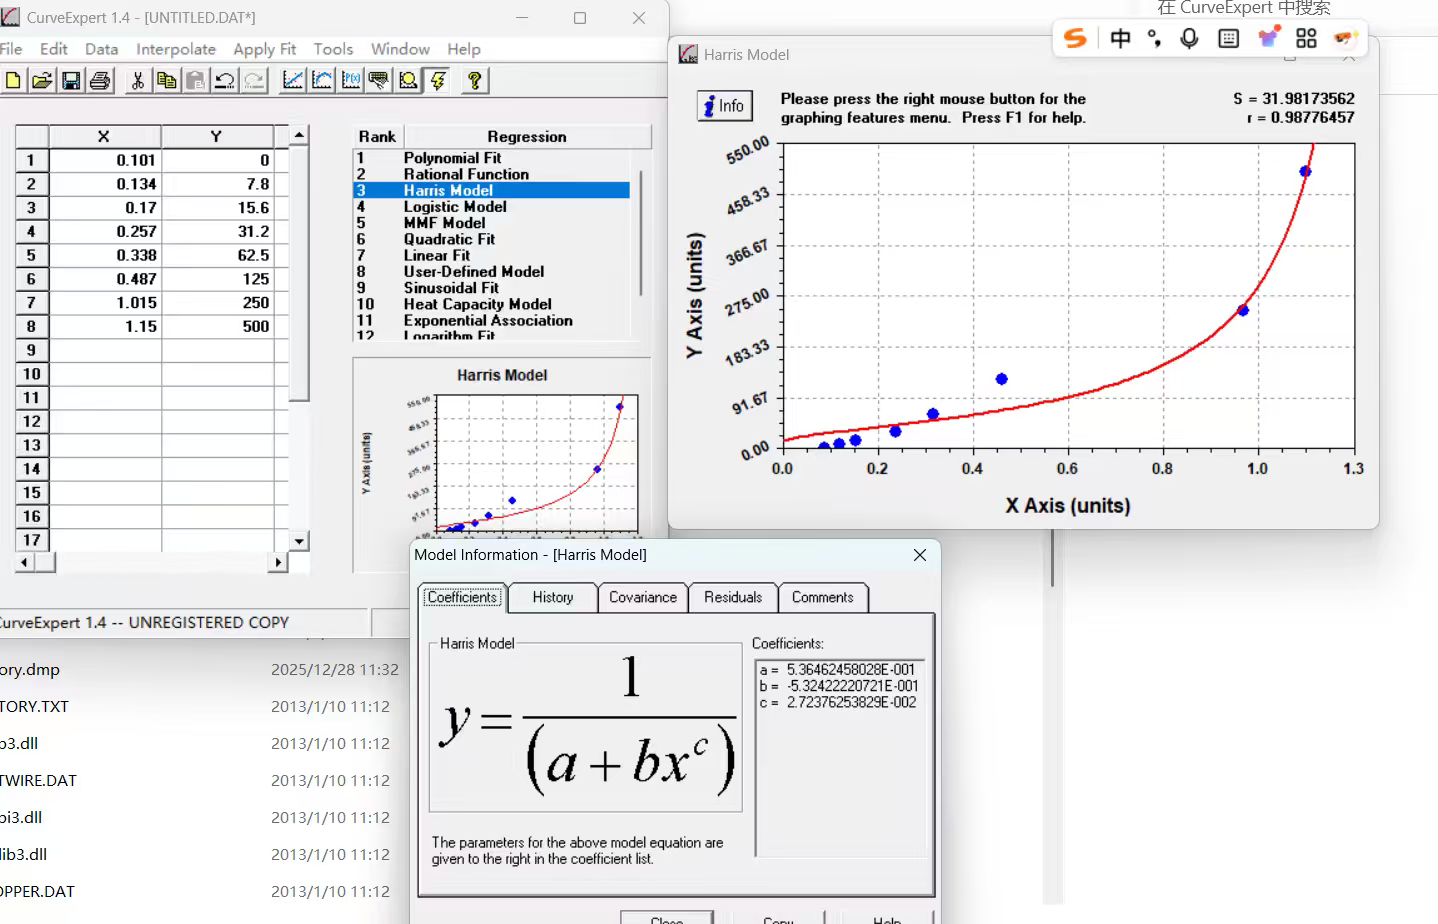
Review: I used the CSB-E04740h to detect the serum TNFa expression level in patients with community-acquired pneumonia. The minimum OD value of the standard curve is 0.101, and the OD value range of the patient group is 0.078-0.512. The detection sensitivity is high, and the TNFa trend in patients with different severity of pneumonia is obvious.
By Anonymous

Sample type: Cell culture supernatant
Sample species: Human
Sample dilution: No dilution
Review: Human TNF-α ELISA kit (CSB-E04740h) was used to detect human cell culture supernatants (normal group, undiluted). All sample detection values were within this linear range. The kit showed good sensitivity and accuracy in the low concentration range, with simple operation, stable results, good repeatability, and reliable data, making it suitable for related research.
By Anonymous
Sample type: Serum
Sample species: Human
Sample dilution: No dilution
Review: I used CSB-E04740h to detect normal serum and LPS-treated serum. The OD value of the standard curve is 3.1309, 1.7778.... The OD value of the sample is around 0.5. The product has good stability, and all indicators are within reasonable values.
By Anonymous

Sample type: Biological fluids Bronchoalveolar lavage fluid (BALF)
Sample species: Human
Sample dilution: No dilution
Review: I used CSB-E04740h to detect the bronchoalveolar lavage fluid of patients with Mycoplasma pneumoniae and the bronchoalveolar lavage fluid of control patients with foreign bodies. The OD values of the experimental group and the control group ranged from 0.201 to 0.406.
By Anonymous